
Page 14 - Balancing Priorities
P. 14
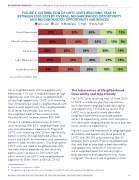
BALANCING PRIORITIES: Preservation and Neighborhood Opportunity in the Low-Income Housing Tax Credit Program Beyond Year 30 FIGURE 4: DISTRIBUTION OF LIHTC UNITS REACHING YEAR 30 BETWEEN 2020-2029 BY OVERALL NEIGHBORHOOD OPPORTUNITY AND NEIGHBORHOOD OPPORTUNITY SUB-INDICES Very-Low Low Moderate High Very-High Overall Opportunity Educational Opportunity Transit Access Labor Market Access Health Environment Source: NLIHC and PAHRC, 2018 29% 22% 20% 17% 12% 32% 24% 22% 13% 9% 20% 22% 24% 20% 14% 27% 23% 23% 24% 20% 20% 17% 18% 14% 15% are in neighborhoods with low opportunity. Meanwhile, 17% are in neighborhoods of high opportunity, and 12% are in neighborhoods of very-high opportunity. LIHTC units reaching Year 30 tend to be sited in neighborhoods with lower overall opportunity than neighborhoods of all renter households, but similar to the neighborhoods of low-income renter households with incomes below 80% AMI. There is a notable concentration of LIHTC units reaching Year 30 in neighborhoods with very-low educational opportunity (Figure 4). LIHTC units reaching Year 30 fare signi cantly better in terms of neighborhood access to transit and health environment, and somewhat better in labor market access. Our nding that LIHTC units are sited in neighborhoods with low educational opportunity, but relatively better access to transit is consistent with other research on LIHTC and neighborhood opportunity (Ellen, Horn, and Kuai, 2018). The Intersection of Neighborhood Desirability and Opportunity For LIHTC units reaching Year 30 from 2020 to 2029, a moderate positive correlation exists between neighborhood desirability and opportunity.8 It stands to reason that LIHTC units located in more desirable neighborhoods tend to provide greater access to opportunity, while units located in less desirable neighborhoods tend to provide lower access to opportunity. Figure 5 shows the intersection of neighborhood desirability and opportunity. Nine percent of LIHTC units (40,509 units) reaching Year 30 between 2020 and 2029 are in neighborhoods that rank high or very-high in both desirability and opportunity, while 2% (7,312) of units are in neighborhoods that are very-high in both desirability and opportunity (not shown in Figure).9 These units are at greatest risk for 8 Correlation coef cient = 0.404 9 Neighborhood characteristics were available for 469,075 units with expiring affordability restrictions. NATIONAL LOW INCOME HOUSING COALITION AND THE PUBLIC AND AFFORDABLE HOUSING RESEARCH CORPORATION 14
