
Page 8 - Balancing Priorities
P. 8
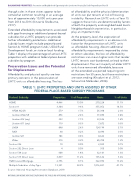
BALANCING PRIORITIES: Preservation and Neighborhood Opportunity in the Low-Income Housing Tax Credit Program Beyond Year 30 though sales in those states appear to be somewhat common resulting in an average loss of approximately 10,000 units per year from 2014 to 2016 (Kincer & Shelburne, 2017). Extended affordability requirements associated with gap nancing or additional project-based subsidies for a LIHTC property can provide further affordability protections. Additional subsidy layers might include project-based Section 8, HOME program funds, USDA Rural Development funds, or state or local funding. Table 1 displays the percentage of active LIHTC properties with additional federal place-based subsidies by program. Preservation Issues and the Potential for Displacement Affordability and physical quality are two primary concerns in the preservation of LIHTC units as affordable housing. The loss of affordability and the physical deterioration of units can put tenants at risk of housing instability. Research on LIHTC units at Year 15 suggests these risks are determined by factors at both the property and neighborhood levels. Neighborhood characteristics, in particular, play an important role. At the property-level, the expiration of affordability requirements is an obvious risk factor for the preservation of LIHTC units as affordable housing. Absent additional affordability requirements imposed by states or other subsidies, the loss of affordability restrictions can mean higher rents that render LIHTC tenants cost-burdened, or lead to their displacement. The vast majority of older LIHTC units have remained affordable, because of the extended use period requiring rent restrictions for 30 years, but those restrictions are soon ending (Khadurri et al. 2012; Schwartz & Meléndez, 2008). TABLE 1: LIHTC PROPERTIES AND UNITS ASSISTED BY OTHER FEDERAL PLACE-BASED SUBSIDY PROGRAMS Federal Subsidy Properties % of Properties Units % of Units HOME 4,466 13.0% 270,228 11.1% 14.5% 2.3% 3.8% 1.4% 0.3% 5.1% 0.3% 0.4% 1.9% 0.1% 0.0% 1.3% 5.6% 13.2% 41.7% Section 8 HFDA NC/SR Section 8 NC/SR Section 202 (any) Section 811 (any) LMSA RAD Section 521 Other Section 236 Section 202 Direct Loan Section 538 Loan Section 515 Direct Loan HUD Insured Mortgage 3,304 9.6% 355,052 579 1.7% 56,368 896 2.6% 91,890 393 1.1% 33,536 110 0.3% 7,872 898 2.6% 124,199 68 0.2% 8,490 186 0.5% 8,622 315 0.9% 45,704 10 0.0% 2,025 4 0.0% 350 608 1.8% 32,141 3,839 11.2% 135,632 2,796 8.1% 322,096 Multiple Subsidies of Any Type Source: National Housing Preservation Database, 2018 NATIONAL LOW INCOME HOUSING COALITION AND THE PUBLIC AND AFFORDABLE HOUSING RESEARCH CORPORATION 8 13,391 38.9% 1,016,821
