
Page 12 - THE GAP: The Affordable Housing Gap Analysis 2019
P. 12
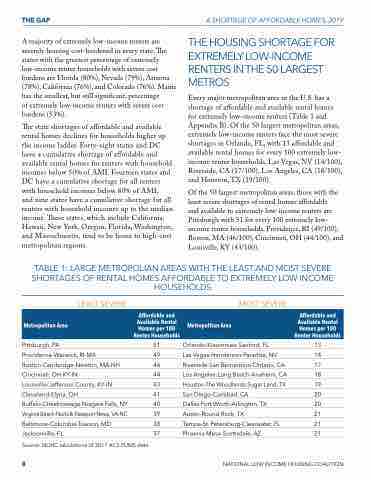
THE GAP A majority of extremely low-income renters are severely housing cost-burdened in every state. e states with the greatest percentage of extremely low-income renter households with severe cost burdens are Florida (80%), Nevada (79%), Arizona (78%), California (76%), and Colorado (76%). Maine has the smallest, but still signi cant, percentage of extremely low-income renters with severe cost burdens (53%). e state shortages of a ordable and available rental homes declines for households higher up the income ladder. Forty-eight states and DC have a cumulative shortage of a ordable and available rental homes for renters with household incomes below 50% of AMI. Fourteen states and DC have a cumulative shortage for all renters with household incomes below 80% of AMI, and nine states have a cumulative shortage for all renters with household incomes up to the median income. ese states, which include California, Hawaii, New York, Oregon, Florida, Washington, and Massachusetts, tend to be home to high-cost metropolitan regions. A SHORTAGE OF AFFORDABLE HOMES, 2019 THE HOUSING SHORTAGE FOR EXTREMELY LOW-INCOME RENTERS IN THE 50 LARGEST METROS Every major metropolitan area in the U.S. has a shortage of a ordable and available rental homes for extremely low-income renters (Table 1 and Appendix B). Of the 50 largest metropolitan areas, extremely low-income renters face the most severe shortages in Orlando, FL, with 13 a ordable and available rental homes for every 100 extremely low- income renter households, Las Vegas, NV (14/100), Riverside, CA (17/100), Los Angeles, CA (18/100), and Houston, TX (19/100). Of the 50 largest metropolitan areas, those with the least severe shortages of rental homes a ordable and available to extremely low-income renters are Pittsburgh with 51 for every 100 extremely low- income renter households, Providence, RI (49/100), Boston, MA (46/100), Cincinnati, OH (44/100), and Louisville, KY (43/100). TABLE 1: LARGE METROPOLIAN AREAS WITH THE LEAST AND MOST SEVERE SHORTAGES OF RENTAL HOMES AFFORDABLE TO EXTREMELY LOW INCOME HOUSEHOLDS LEAST SEVERE MOST SEVERE Metropolitan Area Affordable and Available Rental Homes per 100 Renter Households Metropolitan Area Affordable and Available Rental Homes per 100 Renter Households Pittsburgh, PA Providence-Warwick, RI-MA Boston-Cambridge-Newton, MA-NH Cincinnati, OH-KY-IN Louisville/Jefferson County, KY-IN Cleveland-Elyria, OH Buffalo-Cheektowaga-Niagara Falls, NY Virginia Beach-Norfolk-Newport News, VA-NC Baltimore-Columbia-Towson, MD Jacksonville, FL Source: NLIHC tabulations of 2017 ACS PUMS data. 8 51 49 46 44 43 41 40 39 38 37 Orlando-Kissimmee-Sanford, FL 13 Las Vegas-Henderson-Paradise, NV 14 Riverside-San Bernardino-Ontario, CA 17 Los Angeles-Long Beach-Anaheim, CA 18 Houston-The Woodlands-Sugar Land, TX 19 San Diego-Carlsbad, CA 20 Dallas-Fort Worth-Arlington, TX 20 Austin-Round Rock, TX 21 Tampa-St. Petersburg-Clearwater, FL 21 Phoenix-Mesa-Scottsdale, AZ 21 NATIONAL LOW INCOME HOUSING COALITION
