
Page 25 - THE GAP: The Affordable Housing Gap Analysis 2019
P. 25
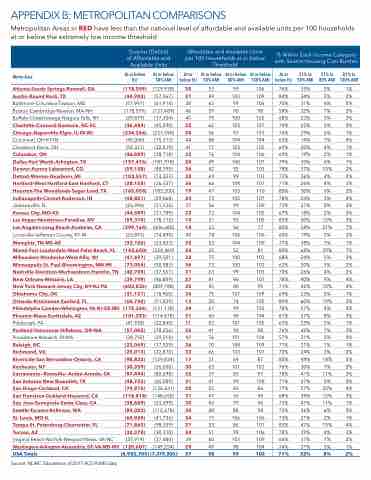
APPENDIX B: METROPOLITAN COMPARISONS Metropolitan Areas in RED have less than the national level of affordable and available units per 100 households at or below the extremely low income threshold Surplus (De cit) of Affordable and Available Units Affordable and Available Units per 100 Households at or below Threshold % Within Each Income Category with Severe Housing Cost Burden Metro Area At or below ELI At or below At or 50% AMI below ELI At or below 50% AMI At or below 80% AMI At or below At or 100% AMI below ELI 31% to 50% AMI 51% to 80% AMI 81% to 100% AMI Atlanta-Sandy Springs-Roswell, GA Austin-Round Rock, TX Baltimore-Columbia-Towson, MD Boston-Cambridge-Newton,MA-NH (118,579) (137,489) 46 Buffalo-Cheektowaga-Niagara Falls, NY (29,879) (17,304) 40 Charlotte-Concord-Gastonia,NC-SC (46,484) (45,290) 32 (118,559) (129,938) 25 (44,902) (57,967) 21 (57,997) (61,914) 38 53 49 62 59 79 62 56 88 77 76 49 42 69 66 47 73 56 73 31 23 78 53 25 75 73 63 41 45 75 20 67 45 83 41 76 70 66 31 63 37 41 25 47 43 48 73 33 51 60 49 99 106 103 109 99 106 90 98 100 102 103 107 97 103 104 104 103 105 104 106 100 107 92 103 99 103 104 107 103 110 105 107 99 109 104 105 92 105 56 77 106 106 104 109 52 81 100 103 100 102 99 103 96 107 80 95 107 109 74 100 99 103 98 104 101 105 90 98 101 104 108 109 103 107 69 87 101 103 83 97 99 108 65 86 76 90 79 96 88 98 106 106 86 101 99 106 103 109 98 104 94 102 76% 35% 5% 1% 84% 34% 5% 2% 70% 31% 6% 0% 58% 32% 7% 2% 68% 23% 3% 2% 74% 25% 5% 0% 76% 29% 6% 1% 65% 14% 1% 0% 69% 20% 4% 1% 69% 19% 2% 1% 79% 30% 6% 1% 78% 37% 10% 2% 73% 26% 4% 2% 71% 26% 4% 3% 80% 30% 6% 2% 78% 24% 3% 0% 73% 31% 8% 3% 67% 18% 2% 0% 83% 50% 12% 3% 80% 58% 21% 7% 60% 19% 2% 2% 77% 38% 7% 1% 80% 68% 29% 7% 68% 24% 5% 3% 62% 20% 3% 2% 70% 26% 4% 2% 78% 40% 9% 4% 71% 42% 10% 4% 69% 23% 5% 1% 89% 60% 19% 2% 78% 27% 4% 2% 81% 37% 8% 2% 63% 23% 5% 1% 76% 42% 7% 2% 57% 21% 2% 0% 71% 21% 1% 1% 70% 24% 3% 0% 80% 44% 18% 5% 76% 30% 7% 5% 78% 41% 11% 2% 71% 37% 5% 0% 77% 57% 20% 4% 68% 39% 12% 2% 73% 41% 11% 1% 72% 36% 6% 0% 73% 21% 2% 1% 83% 47% 15% 4% 78% 39% 4% 3% 66% 37% 7% 2% 74% 31% 5% 1% 71% 32% 8% 2% Chicago-Naperville-Elgin,IL-IN-WI Cincinnati, OH-KY-IN Cleveland-Elyria, OH Columbus, OH Dallas-Fort Worth-Arlington, TX Denver-Aurora-Lakewood, CO Detroit-Warren-Dearborn, MI Hartford-West Hartford-East Hartford, CT Houston-The Woodlands-Sugar Land, TX Indianapolis-Carmel-Anderson, IN Jacksonville, FL Kansas City, MO-KS Las Vegas-Henderson-Paradise, NV Los Angeles-Long Beach-Anaheim, CA Louisville/Jefferson County, KY-IN Memphis, TN-MS-AR Miami-Fort Lauderdale-West Palm Beach, FL Milwaukee-Waukesha-West Allis, WI Minneapolis-St. Paul-Bloomington, MN-WI Nashville-Davidson-Murfreesboro-Franklin, TN New Orleans-Metairie, LA New York-Newark-Jersey City, NY-NJ-PA Oklahoma City, OK Orlando-Kissimmee-Sanford, FL Philadelphia-Camden-Wilmington, PA-NJ-DE-MD Phoenix-Mesa-Scottsdale, AZ Pittsburgh, PA Portland-Vancouver-Hillsboro,OR-WA Providence-Warwick, RI-MA Raleigh, NC Richmond, VA Riverside-San Bernardino-Ontario, CA Rochester, NY Sacramento--Roseville--Arden-Arcade,CA San Antonio-New Braunfels, TX San Diego-Carlsbad, CA San Francisco-Oakland-Hayward, CA San Jose-Sunnyvale-Santa Clara, CA Seattle-Tacoma-Bellevue, WA St. Louis, MO-IL Tampa-St. Petersburg-Clearwater, FL Tucson,AZ Virginia Beach-Norfolk-Newport News, VA-NC Washington-Arlington-Alexandria, DC-VA-MD-WV USA Totals (234,266) (237,590) 28 (45,000) (15,313) 44 (54,321) (32,819) 41 (46,889) (157,476) (59,158) (103,557) (28,158) (165,058) (48,821) (28,718) 33 (181,978) 20 (88,395) 26 (73,323) 32 (26,537) 36 (183,200) 19 (29,868) 24 (26,996) (31,336) 37 (44,589) (59,370) (399,164) (26,893) (32,126) (142,600) (47,697) (73,054) (40,705) (39,749) (603,836) (31,121) (60,742) (175,364) (101,293) (31,789) 33 (78,112) 14 (606,680) 18 (14,895) 43 (33,823) 33 (224,469) 24 (29,501) 32 (50,983) 36 (37,561) 31 (46,889) 27 (809,788) 35 (18,960) 34 (91,029) 13 (131,138) 34 (114,878) 21 (41,938) (22,840) 51 (57,002) (78,256) 25 (38,792) (29,218) 49 (23,065) (25,013) (98,832) (30,359) (57,494) (48,725) (79,876) (118,818) (38,689) (89,022) (60,020) (71,865) (32,378) (30,310) (35,919) (37,480) (120,607) (149,254) (6,982,705) (7,379,206) 26 33 17 30 22 31 20 31 30 30 34 21 24 39 29 37 58 (17,559) (22,870) (129,834) (26,606) (80,698) (65,089) (136,631) (148,658) (53,699) (112,678) (41,736) (98,359) Source: NLIHC Tabulations of 2017 ACS PUMS data
