
Page 15 - THE GAP: The Affordable Housing Gap Analysis 2019
P. 15
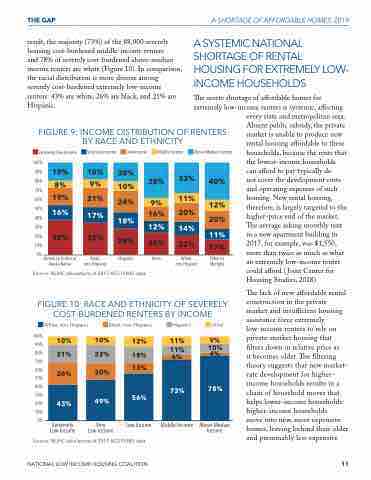
THE GAP result, the majority (73%) of the 88,000 severely housing cost-burdened middle-income renters and 78% of severely cost-burdened above-median income renters are white (Figure 10). In comparison, the racial distribution is more diverse among severely cost-burdened extremely low-income renters: 43% are white, 26% are black, and 21% are Hispanic. A SHORTAGE OF AFFORDABLE HOMES, 2019 A SYSTEMIC NATIONAL SHORTAGE OF RENTAL HOUSING FOR EXTREMELY LOW- INCOME HOUSEHOLDS e severe shortage of a ordable homes for extremely low-income renters is systemic, a ecting FIGURE 9: INCOME DISTRIBUTION OF RENTERS BY RACE AND ETHNICITY every state and metropolitan area. Absent public subsidy, the private market is unable to produce new rental housing a ordable to these households, because the rents that the lowest-income households can a ord to pay typically do not cover the development costs and operating expenses of such housing. New rental housing, therefore, is largely targeted to the higher-price end of the market. e average asking monthly rent in a new apartment building in 2017, for example, was $1,550, more than twice as much as what an extremely low-income renter could a ord ( Joint Center for Housing Studies, 2018). e lack of new a ordable rental construction in the private market and insu cient housing assistance force extremely low-income renters to rely on private-market housing that lters down in relative price as it becomes older. e ltering theory suggests that new market- rate development for higher- income households results in a chain of household moves that helps lower-income households: higher-income households move into new, more expensive homes, leaving behind their older and presumably less expensive Extremely Low-Income 100% 90% 80% 70% 60% 50% 40% 30% 20% 10% 0% American Indian or Alaska Native Very Low-Income Low-Income Middle-Income Above Median Income 19% 18% 9% 20% 38% 33% 40% 8% 10% 19% 21% 24% 11% 9% 12% 16% 16% 20% 17% 18% 20% 38% 12% 14% 35% 28% 11% 25% 22% 17% Black, non-Hispanic Hispanic Asian White, non-Hispanic Other or Multiple Source: NLIHC tabulations of 2017 ACS PUMS data. FIGURE 10: RACE AND ETHNICITY OF SEVERELY COST-BURDENED RENTERS BY INCOME 100% 90% 80% 70% 60% 50% 40% 30% 20% 10% 0% Extremely Low-Income Very Low-Income Low-Income Above Median Income White, non-Hispanic Black, non-Hispanic Hispanic 6% Middle-Income Other 10% 10% 12% 9% 21% 22% 18% 26% 20% 13% 43% 49% 56% 73% 78% 11% 11% 10% 4% Source: NLIHC tabulations of 2017 ACS PUMS data. NATIONAL LOW INCOME HOUSING COALITION 11
