
Page 16 - THE GAP: The Affordable Housing Gap Analysis 2019
P. 16
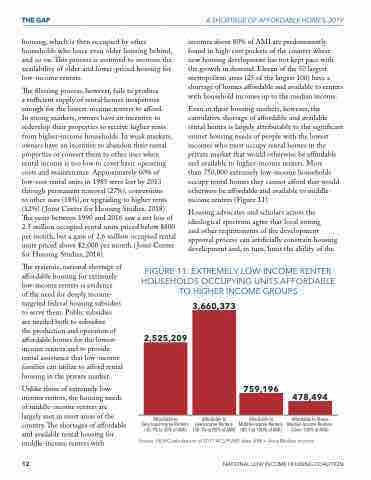
THE GAP housing, which is then occupied by other households who leave even older housing behind, and so on. is process is assumed to increase the availability of older and lower-priced housing for low-income renters. e ltering process, however, fails to produce a su cient supply of rental homes inexpensive enough for the lowest-income renters to a ord. In strong markets, owners have an incentive to redevelop their properties to receive higher rents from higher-income households. In weak markets, owners have an incentive to abandon their rental properties or convert them to other uses when rental income is too low to cover basic operating costs and maintenance. Approximately 60% of low-cost rental units in 1985 were lost by 2013 through permanent removal (27%), conversions to other uses (18%), or upgrading to higher rents (12%) ( Joint Center for Housing Studies, 2018). e years between 1990 and 2016 saw a net loss of 2.5 million occupied rental units priced below $800 per month, but a gain of 2.6 million occupied rental units priced above $2,000 per month ( Joint Center for Housing Studies, 2018). A SHORTAGE OF AFFORDABLE HOMES, 2019 e systemic, national shortage of a ordable housing for extremely low-income renters is evidence of the need for deeply income- targeted federal housing subsidies to serve them. Public subsidies are needed both to subsidize the production and operation of a ordable homes for the lowest- income renters and to provide rental assistance that low-income families can utilize to a ord rental housing in the private market. Unlike those of extremely low- income renters, the housing needs of middle-income renters are largely met in most areas of the country. e shortages of a ordable and available rental housing for middle-income renters with 12 FIGURE 11: EXTREMELY LOW-INCOME RENTER HOUSEHOLDS OCCUPYING UNITS AFFORDABLE TO HIGHER INCOME GROUPS incomes above 80% of AMI are predominantly found in high-cost pockets of the country where new housing development has not kept pace with the growth in demand. Eleven of the 50 largest metropolitan areas (25 of the largest 100) have a shortage of homes a ordable and available to renters with household incomes up to the median income. Even in these housing markets, however, the cumulative shortage of a ordable and available rental homes is largely attributable to the signi cant unmet housing needs of people with the lowest incomes who must occupy rental homes in the private market that would otherwise be a ordable and available to higher-income renters. More than 750,000 extremely low-income households occupy rental homes they cannot a ord that would otherwise be a ordable and available to middle- income renters (Figure 11). Housing advocates and scholars across the ideological spectrum agree that local zoning and other requirements of the development approval process can arti cially constrain housing development and, in turn, limit the ability of the 3,660,373 2,525,209 Affordable to Very Low-Income Renters (30.1% to 50% of AMI) Affordable to Low-Income Renters (50.1% to 80% of AMI) 759,196 Affordable to Middle-Income Renters (80.1 to 100% of AMI) 478,494 Affordable to Above Median Income Renters (Over 100% of AMI) Source: NLIHC tabulations of 2017 ACS PUMS data. AMI = Area Median Income NATIONAL LOW INCOME HOUSING COALITION
