
Page 6 - THE GAP: The Affordable Housing Gap Analysis 2019
P. 6
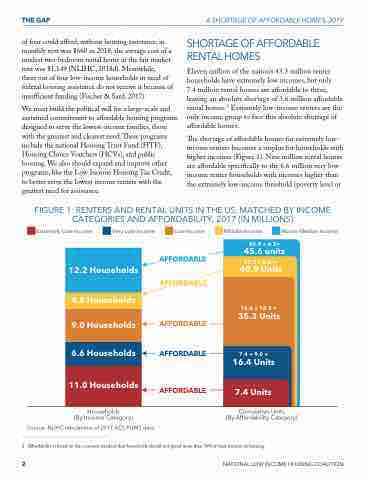
THE GAP A SHORTAGE OF AFFORDABLE HOMES, 2019 SHORTAGE OF AFFORDABLE RENTAL HOMES Eleven million of the nation’s 43.3 million renter households have extremely low incomes, but only 7.4 million rental homes are a ordable to them, leaving an absolute shortage of 3.6 million a ordable rental homes.2 Extremely low-income renters are the only income group to face this absolute shortage of a ordable homes. e shortage of a ordable homes for extremely low- income renters becomes a surplus for households with higher incomes (Figure 1). Nine million rental homes are a ordable speci cally to the 6.6 million very low- income renter households with incomes higher than the extremely low-income threshold (poverty level or of four could a ord, without housing assistance, in monthly rent was $660 in 2018; the average cost of a modest two-bedroom rental home at the fair market rent was $1,149 (NLIHC, 2018d). Meanwhile, three out of four low-income households in need of federal housing assistance do not receive it because of insu cient funding (Fischer & Sard, 2017). We must build the political will for a large-scale and sustained commitment to a ordable housing programs designed to serve the lowest-income families, those with the greatest and clearest need. ese programs include the national Housing Trust Fund (HTF), Housing Choice Vouchers (HCVs), and public housing. We also should expand and improve other programs, like the Low Income Housing Tax Credit, to better serve the lowest income renters with the greatest need for assistance. FIGURE 1: RENTERS AND RENTAL UNITS IN THE US, MATCHED BY INCOME CATEGORIES AND AFFORDABILITY, 2017 (IN MILLIONS) Extremely Low-Income Very Low-Income Low-Income AFFORDABLE AFFORDABLE AFFORDABLE AFFORDABLE AFFORDABLE Middle-Income Above Median Income 40.9 + 4.7= 45.6 units 35.3 + 5.6 = 40.9 Units 16.4 + 18.9 = 35.3 Units 7.4 + 9.0 = 16.4 Units 7.4 Units Cumulative Units (By Affordability Category) 12.2 Households 4.5 Households 9.0 Households 6.6 Households 11.0 Households Households (By Income Category) Source: NLIHC tabulations of 2017 ACS PUMS data. 2 A ordabilityisbasedonthecommonstandardthathouseholdsshouldnotspendmorethan30%oftheirincomeonhousing. 2 NATIONAL LOW INCOME HOUSING COALITION
