
Page 7 - THE GAP: The Affordable Housing Gap Analysis 2019
P. 7
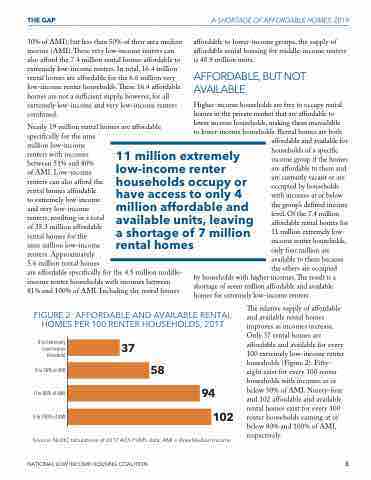
THE GAP 30% of AMI), but less than 50% of their area median income (AMI). ese very low-income renters can also a ord the 7.4 million rental homes a ordable to extremely low-income renters. In total, 16.4 million rental homes are a ordable for the 6.6 million very low-income renter households. ese 16.4 a ordable homes are not a su cient supply, however, for all extremely low-income and very low-income renters combined. Nearly 19 million rental homes are a ordable speci cally for the nine A SHORTAGE OF AFFORDABLE HOMES, 2019 million low-income renters with incomes between 51% and 80% of AMI. Low-income renters can also a ord the rental homes a ordable to extremely low-income and very low-income renters, resulting in a total of 35.3 million a ordable rental homes for the 11 million extremely low-income renter households occupy or have access to only 4 million affordable and available units, leaving a shortage of 7 million rental homes a ordable and available for households of a speci c income group if the homes are a ordable to them and are currently vacant or are occupied by households with incomes at or below the group’s de ned income level. Of the 7.4 million a ordable rental homes for 11 million extremely low- income renter households, only four million are available to them because the others are occupied a ordable to lower-income groups, the supply of a ordable rental housing for middle-income renters is 40.9 million units. AFFORDABLE, BUT NOT AVAILABLE Higher-income households are free to occupy rental homes in the private market that are a ordable to lower income households, making them unavailable to lower-income households. Rental homes are both nine million low-income renters. Approximately 5.6 million rental homes are a ordable speci cally for the 4.5 million middle- income renter households with incomes between 81% and 100% of AMI. Including the rental homes by households with higher incomes. e result is a shortage of seven million a ordable and available homes for extremely low-income renters. FIGURE 2: AFFORDABLE AND AVAILABLE RENTAL HOMES PER 100 RENTER HOUSEHOLDS, 2017 e relative supply of a ordable and available rental homes improves as incomes increase. Only 37 rental homes are a ordable and available for every 100 extremely low-income renter households (Figure 2). Fifty- eight exist for every 100 renter households with incomes at or below 50% of AMI. Ninety-four and 102 a ordable and available rental homes exist for every 100 renter households earning at or below 80% and 100% of AMI, respectively. 0 to Extremely Low-Income threshold 0to50%ofAMI 37 0to80%ofAMI 0to100%ofAMI Source: NLIHC tabulations of 2017 ACS PUMS data. AMI = Area Median Income 58 94 102 NATIONAL LOW INCOME HOUSING COALITION 3
