
Page 8 - THE GAP: The Affordable Housing Gap Analysis 2019
P. 8
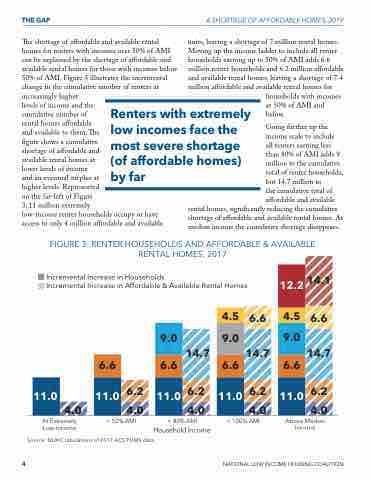
THE GAP A SHORTAGE OF AFFORDABLE HOMES, 2019 e shortage of a ordable and available rental homes for renters with incomes over 50% of AMI can be explained by the shortage of a ordable and available rental homes for those with incomes below 50% of AMI. Figure 3 illustrates the incremental change in the cumulative number of renters at increasingly higher levels of income and the cumulative number of rental homes a ordable and available to them. e gure shows a cumulative shortage of a ordable and available rental homes at lower levels of income and an eventual surplus at higher levels. Represented on the far-left of Figure 3, 11 million extremely low-income renter households occupy or have access to only 4 million a ordable and available units, leaving a shortage of 7 million rental homes. Moving up the income ladder to include all renter households earning up to 50% of AMI adds 6.6 million renter households and 6.2 million a ordable and available rental homes, leaving a shortage of 7.4 million a ordable and available rental homes for Renters with extremely low incomes face the most severe shortage (of affordable homes) by far households with incomes at 50% of AMI and below. Going further up the income scale to include all renters earning less than 80% of AMI adds 9 million to the cumulative total of renter households, but 14.7 million to the cumulative total of a ordable and available rental homes, signi cantly reducing the cumulative shortage of a ordable and available rental homes. At median income the cumulative shortage disappears. FIGURE 3: RENTER HOUSEHOLDS AND AFFORDABLE & AVAILABLE RENTAL HOMES, 2017 Incremental Increase in Households Incremental Increase in Affordable & Available Rental Homes 12.2 14.1 6.6 14.7 6.2 4.0 4.5 6.6 14.7 6.2 4.0 4.5 9.0 14.7 6.2 4.0 9.0 9.0 6.6 6.6 6.6 6.6 11.0 11.0 6.2 4.0 11.0 11.0 11.0 4.0 4 NATIONAL LOW INCOME HOUSING COALITION At Extremely < 50% AMI < 80% AMI Low-Income Household Income Source: NLIHC tabulations of 2017 ACS PUMS data. < 100% AMI Above Median Income
