These data were obtained through the National Fair Housing Alliance (NFHA) and HUD Department of Fair Housing and Equal Opportunity (FHEO).
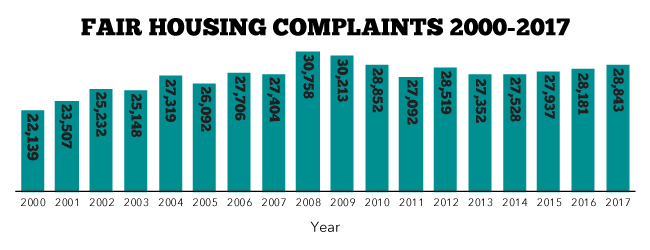
These charts analyze fair housing complaints data. The first graph shows a comparison between 2017 data and the data from the previous two decades. The number of housing discrimination complaints filed have not changed significantly over time. From 2000 to 2017, each year had between 20,000 and 31,000 housing discrimination complaints, and the number of complaints filed has slightly increased in the past few years.
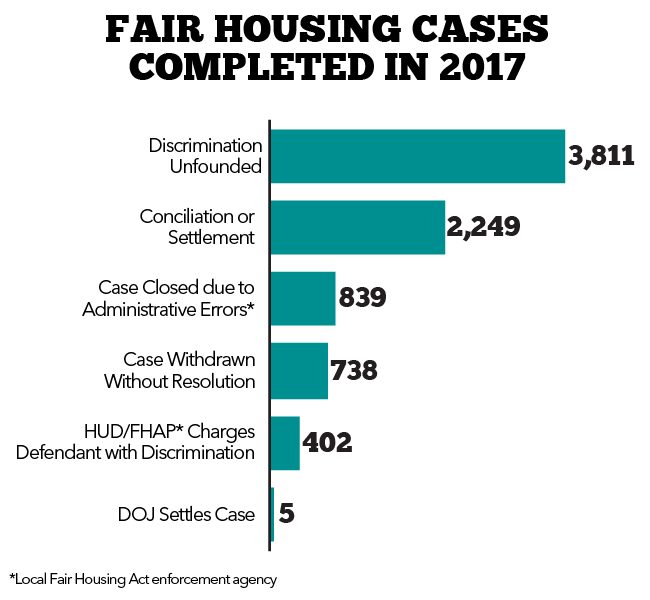
Figure 2 shows what happened in the cases that were filed in 2017. In 3,811 cases, no discriminatory action could be proven legally; 2,249 cases were settled and in 402 cases the defendant was found guilty of discrimination by HUD or a FHAP, a local Fair Housing Act enforcement agency. Some of these cases resulted in monetary compensation for the victims. More than 800 cases were dismissed due to administrative errors; this can occur in cases when documents are filed late or if investigators cannot find enough evidence to hold a hearing. Finally, more than 700 cases were withdrawn by the plaintiff with no resolution.
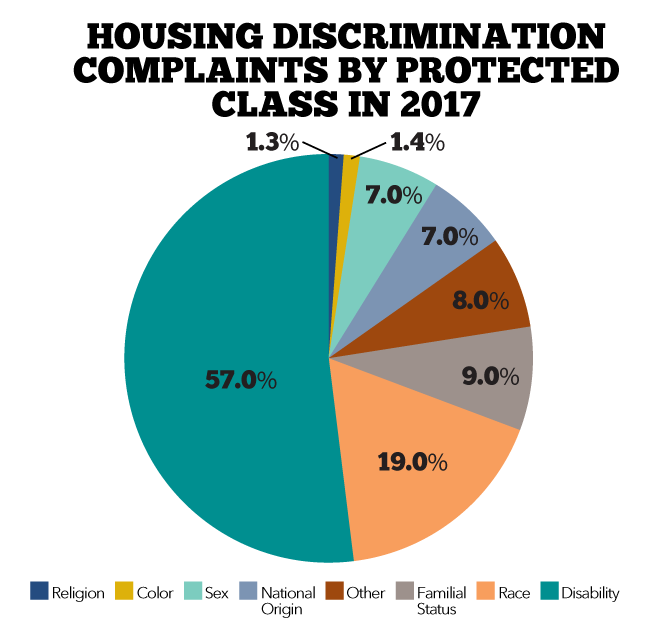
Figure 3 shows the number of housing discrimination complaints filed by each protected class. The majority of fair housing complaints are brought forward for discrimination on the basis of disability. This is usually demonstrated legally by showing that a landlord failed to provide reasonable accommodations to a potential tenant. The “other” category includes some groups that are protected under state and local laws such as sexual orientation, gender identity, and income type, among others.