This page has graphics from the report that you can download, as well as a form for our 2018 Press Kit.
Download social media graphics (zip file) to promote Out of Reach In English and In Spanish.
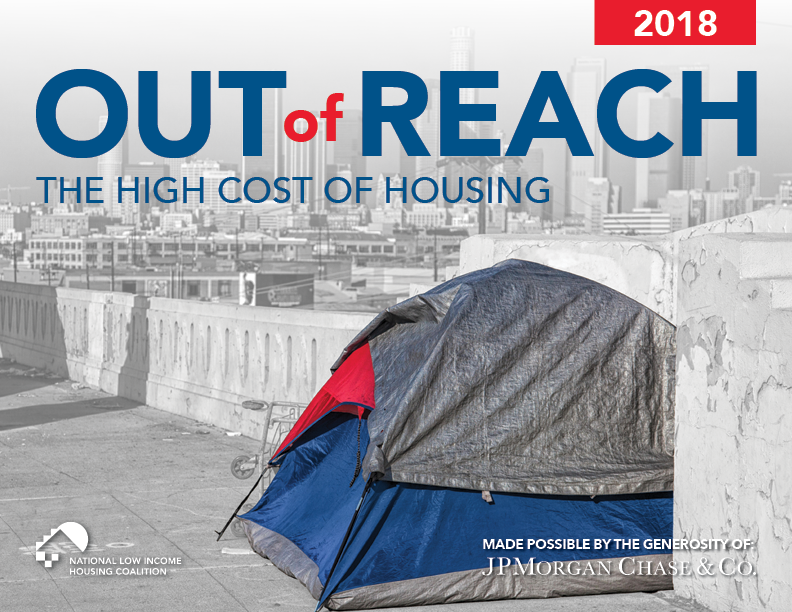
Out of Reach 2018 Report Graphics
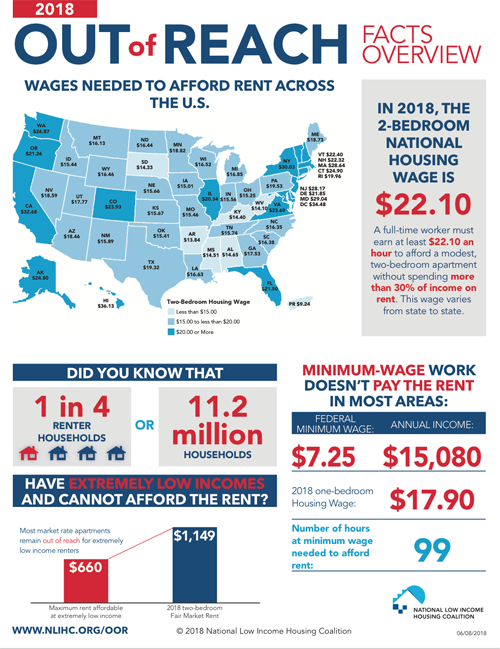 Out of Reach 2018 Factsheet (PDF)
A handout with several different infographics and details from the report.
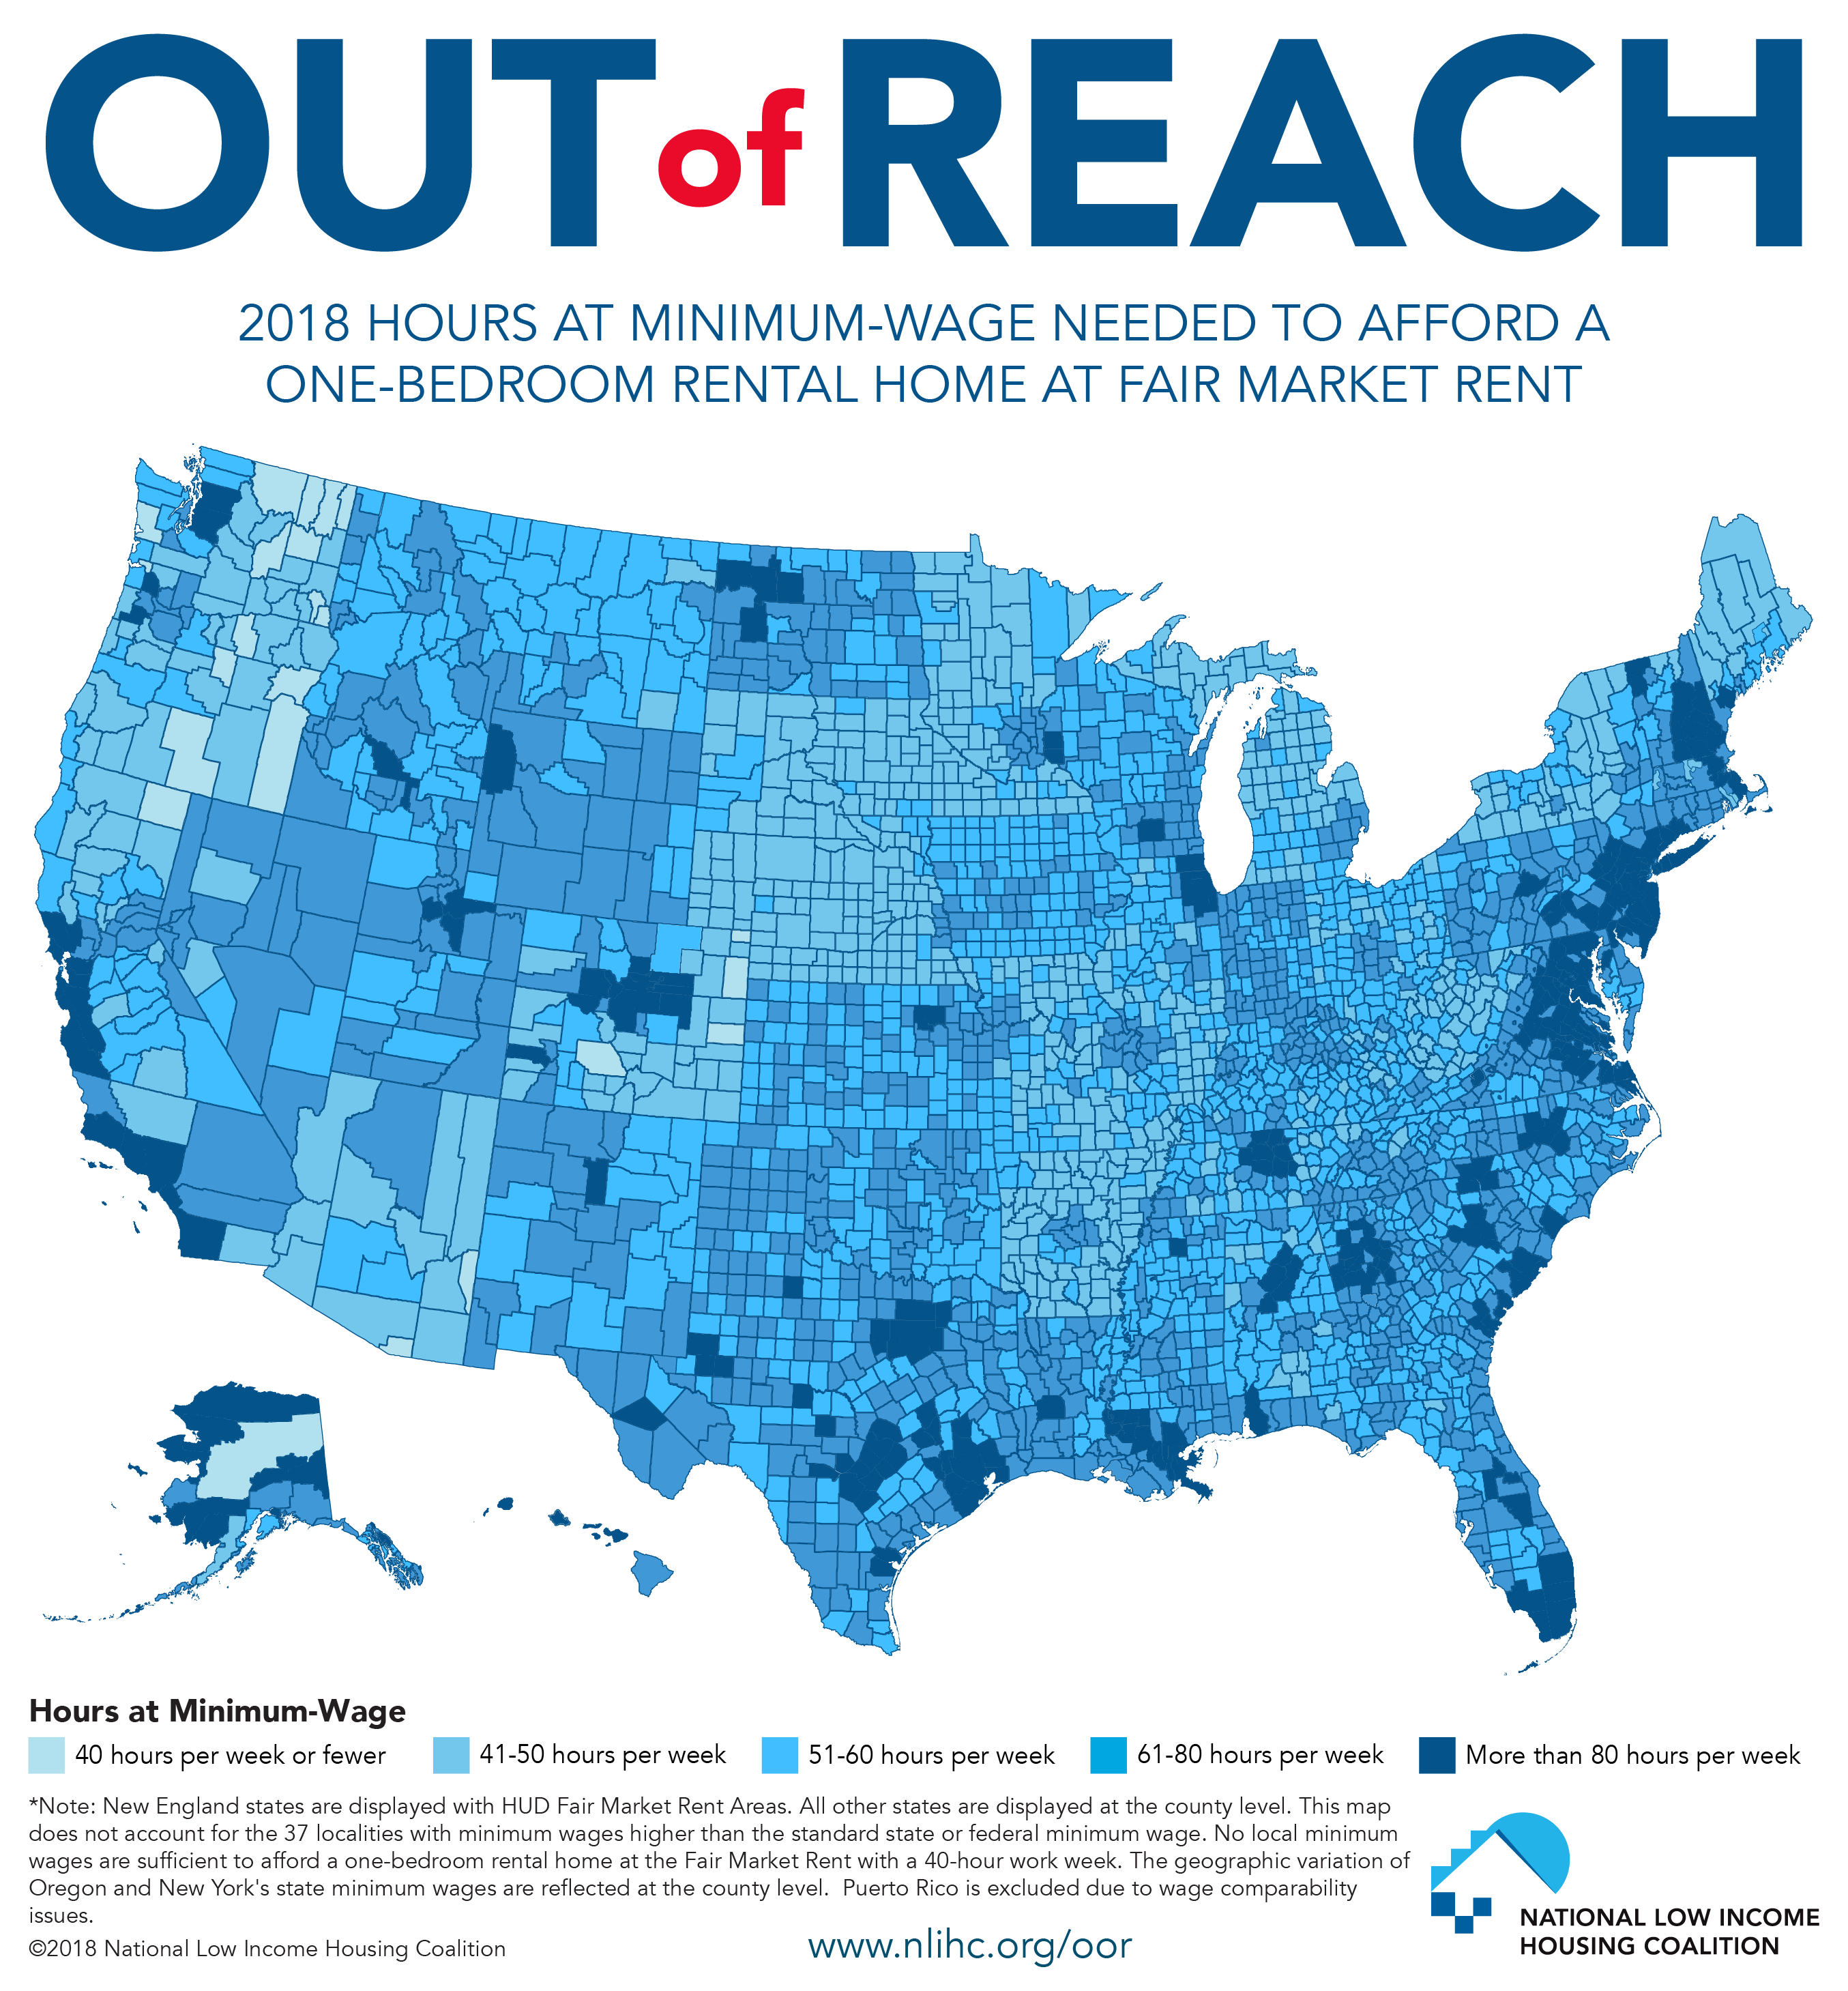 2018 Hours at Minimum Wage Needed to Afford Rent (Map) (PDF)
A map showing the number of hours someone earning the minimum wage needs to work to afford a one-bedroom apartment at fair market rent.
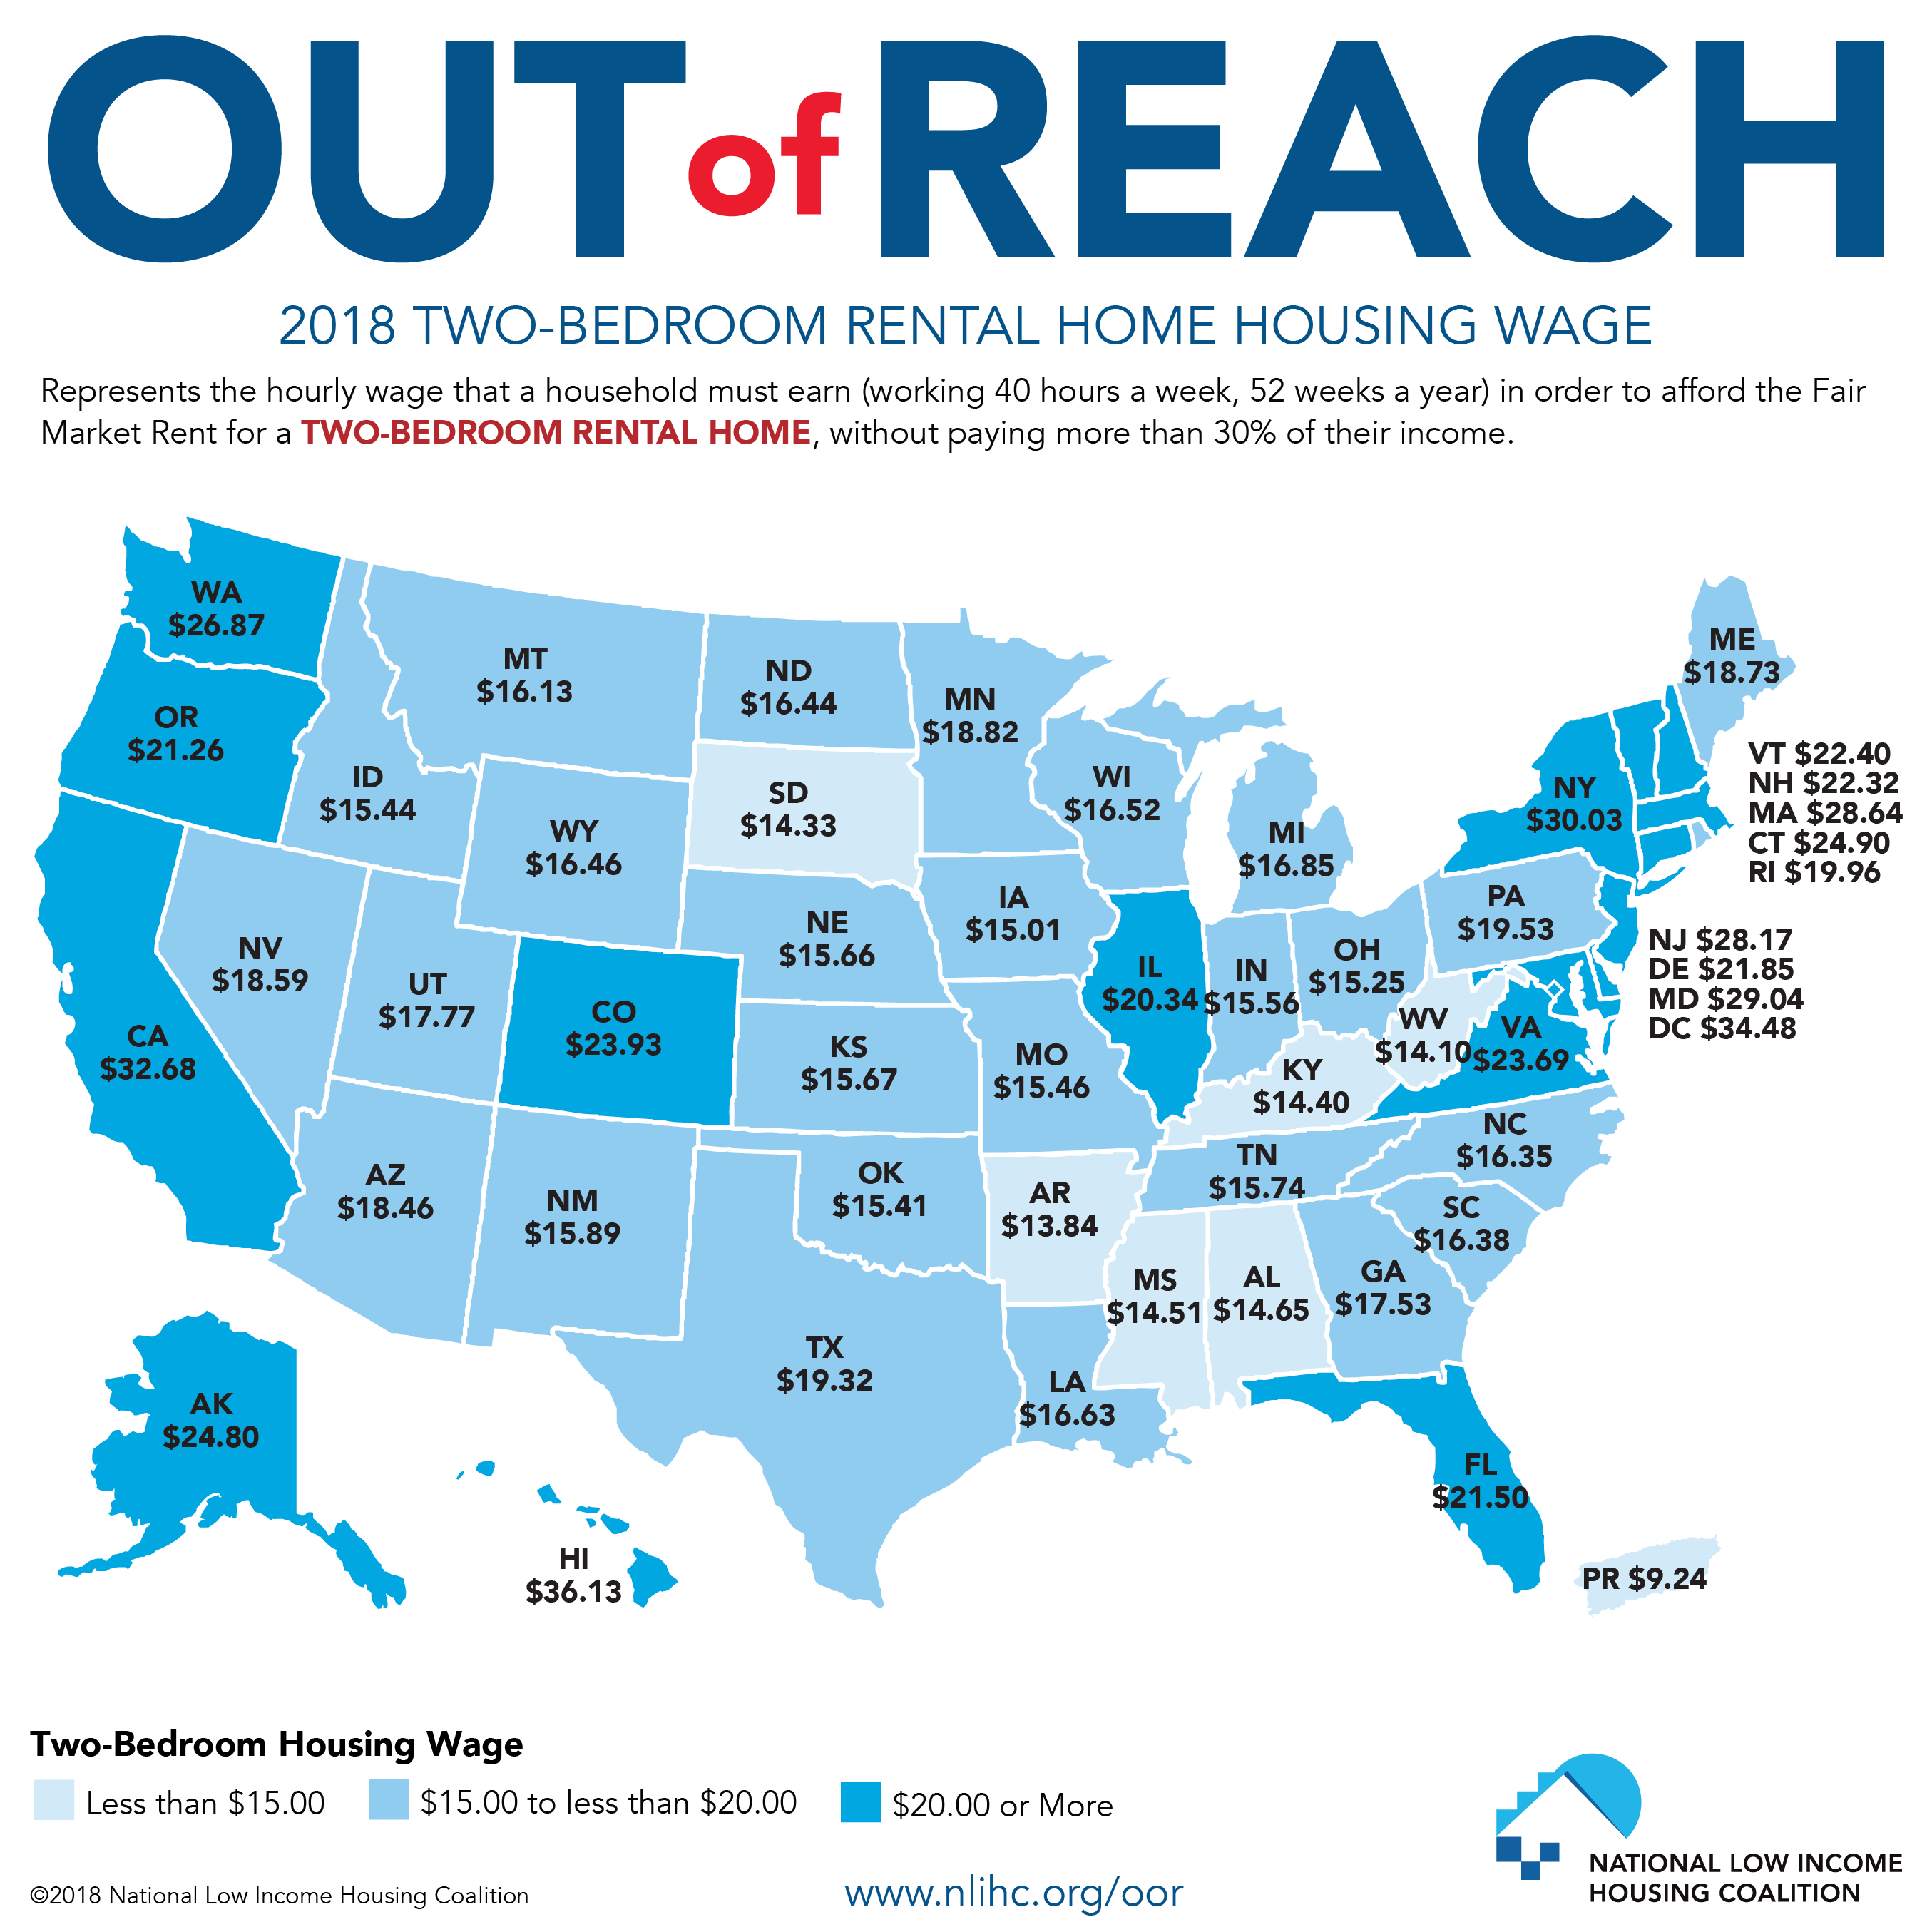 2018 Two-Bedroom Rental Housing Wage (Map) (PDF)
A map that represents the hourly wage that a household must earn (working 40 hours a week, 52 weeks a year) in order to afford the Fair Market Rent for a two-bedroom rental unit, without paying more than 30% of their income.
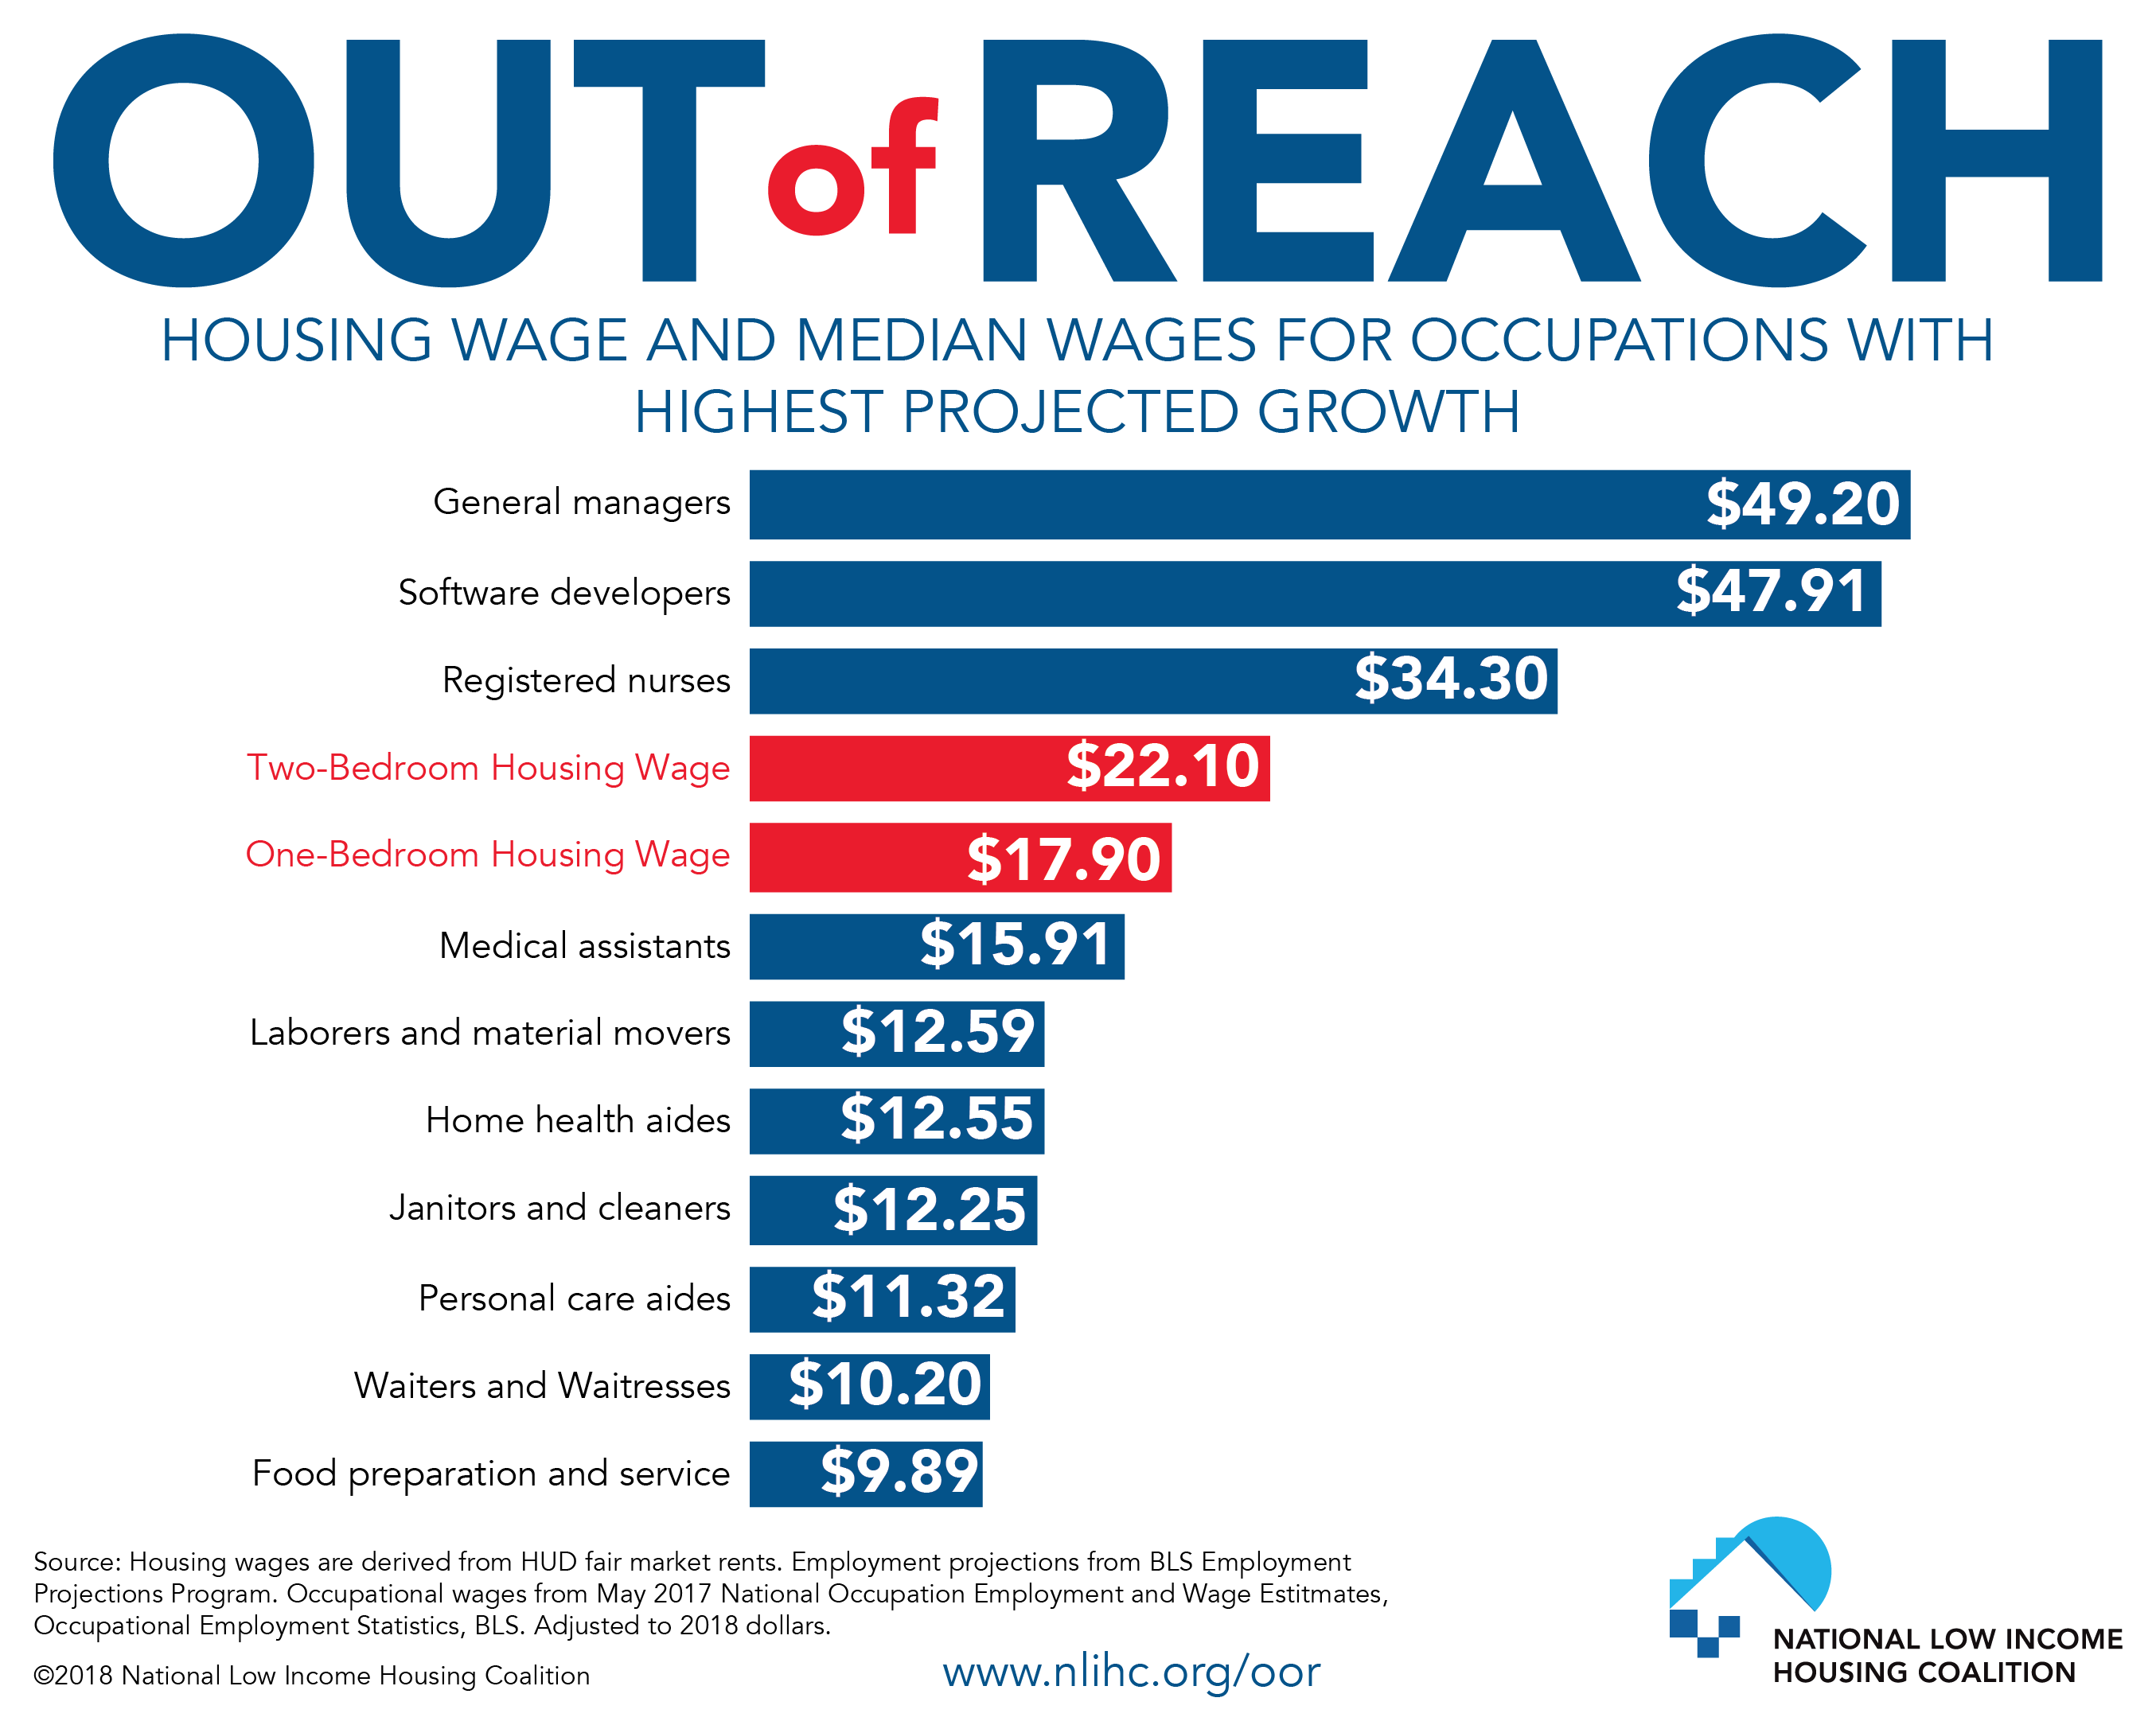 Housing Wage and Median Wages for Occupations with Highest Projected Growth (PDF)
The wage a full-time worker must earn to afford a modest rental home at fair market rent compared to median wages of occupations projected to have the greatest growth over the next 10 years.
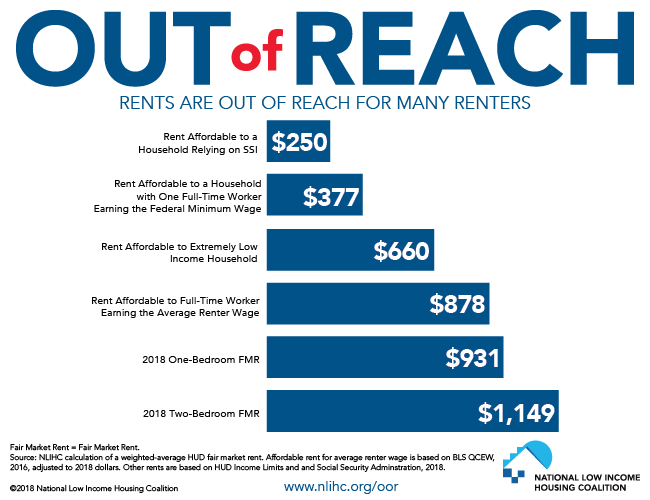 Rents are Out of Reach for Many Renters (PDF)
The rental cost that various households can afford compared to the fair market rent of a modest one-bedroom or two-bedroom apartment.
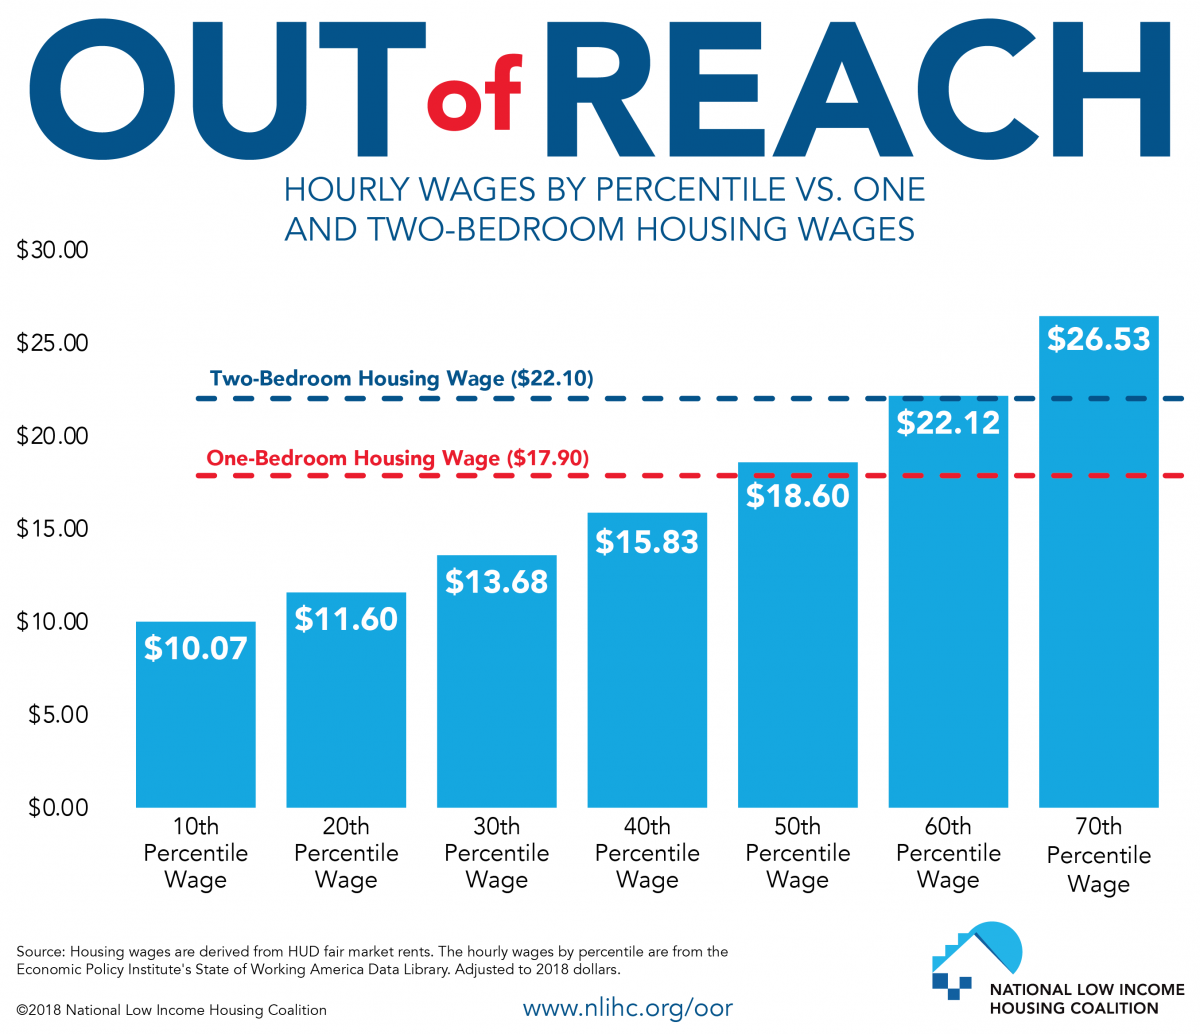 Hourly Wages by Percentile vs. Housing Wage (PDF)
Hourly wages compared to the wage a full-time worker must earn to afford a modest one-bedroom or two-bedroom rental home (i.e, the Housing Wage).
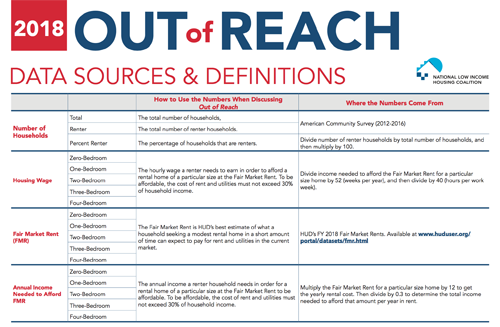 Data Sources and Definitions (PDF)
A quick reference guide on what the numbers are, how to use the numbers when referring to Out of Reach, and where the numbers come from.