The Gap Press Contact and Kit
Please complete the information below to receive press updates on NLIHC's The Gap: A Shortage of Affordable Homes.
The press kit (Google Drive) contains images from The Gap that can be used online or in print. Permission to reprint all or some of the images is granted, provided appropriate credit is given to the National Low Income Housing Coalition (NLIHC). All images are copyright of NLIHC.
For questions regarding media coverage and reprints, please contact Lisa Marlow, Director of Communications, [email protected], 202-662-1530 x813.
Images from The Gap 2025
Individual graphics are available below or download all the graphics (Google Drive).
English (PNG)
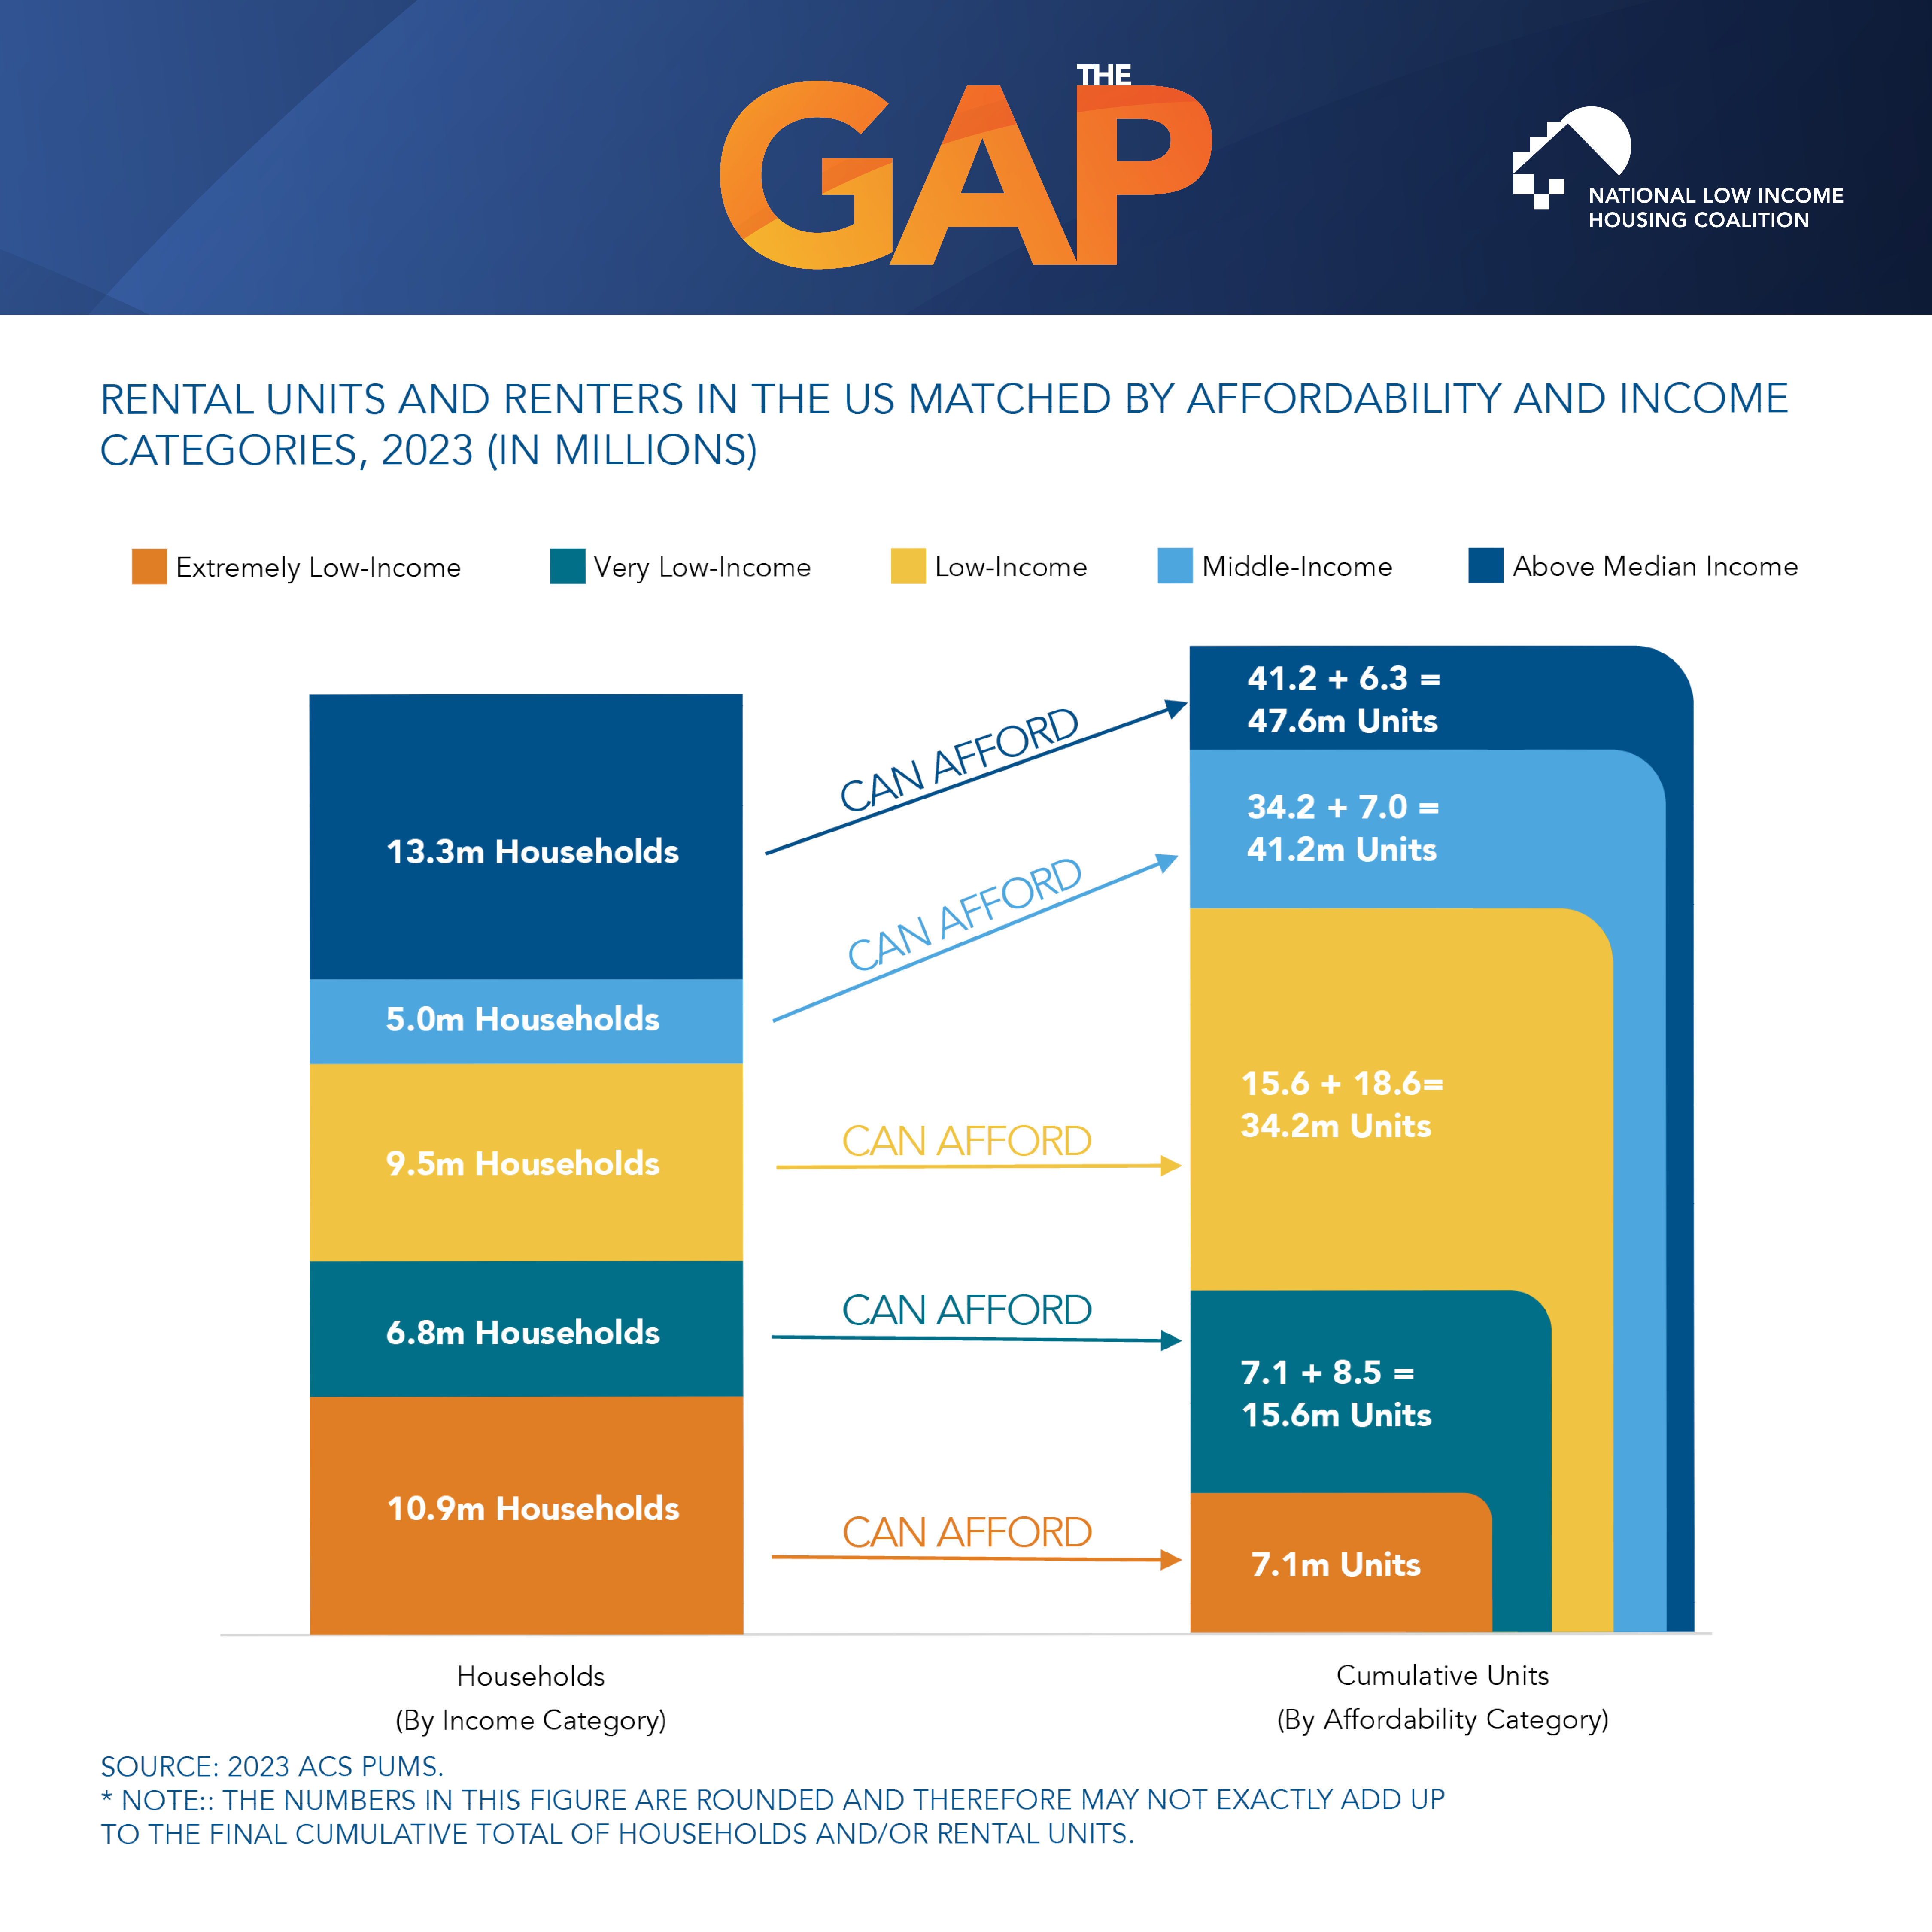
Renters and Rental Units in the U.S.
Chart of renters and rental units in the U.S., matched by income and affordability categories. Renters with extremely low incomes face an absolute shortage of affordable rental homes.
English (PNG)
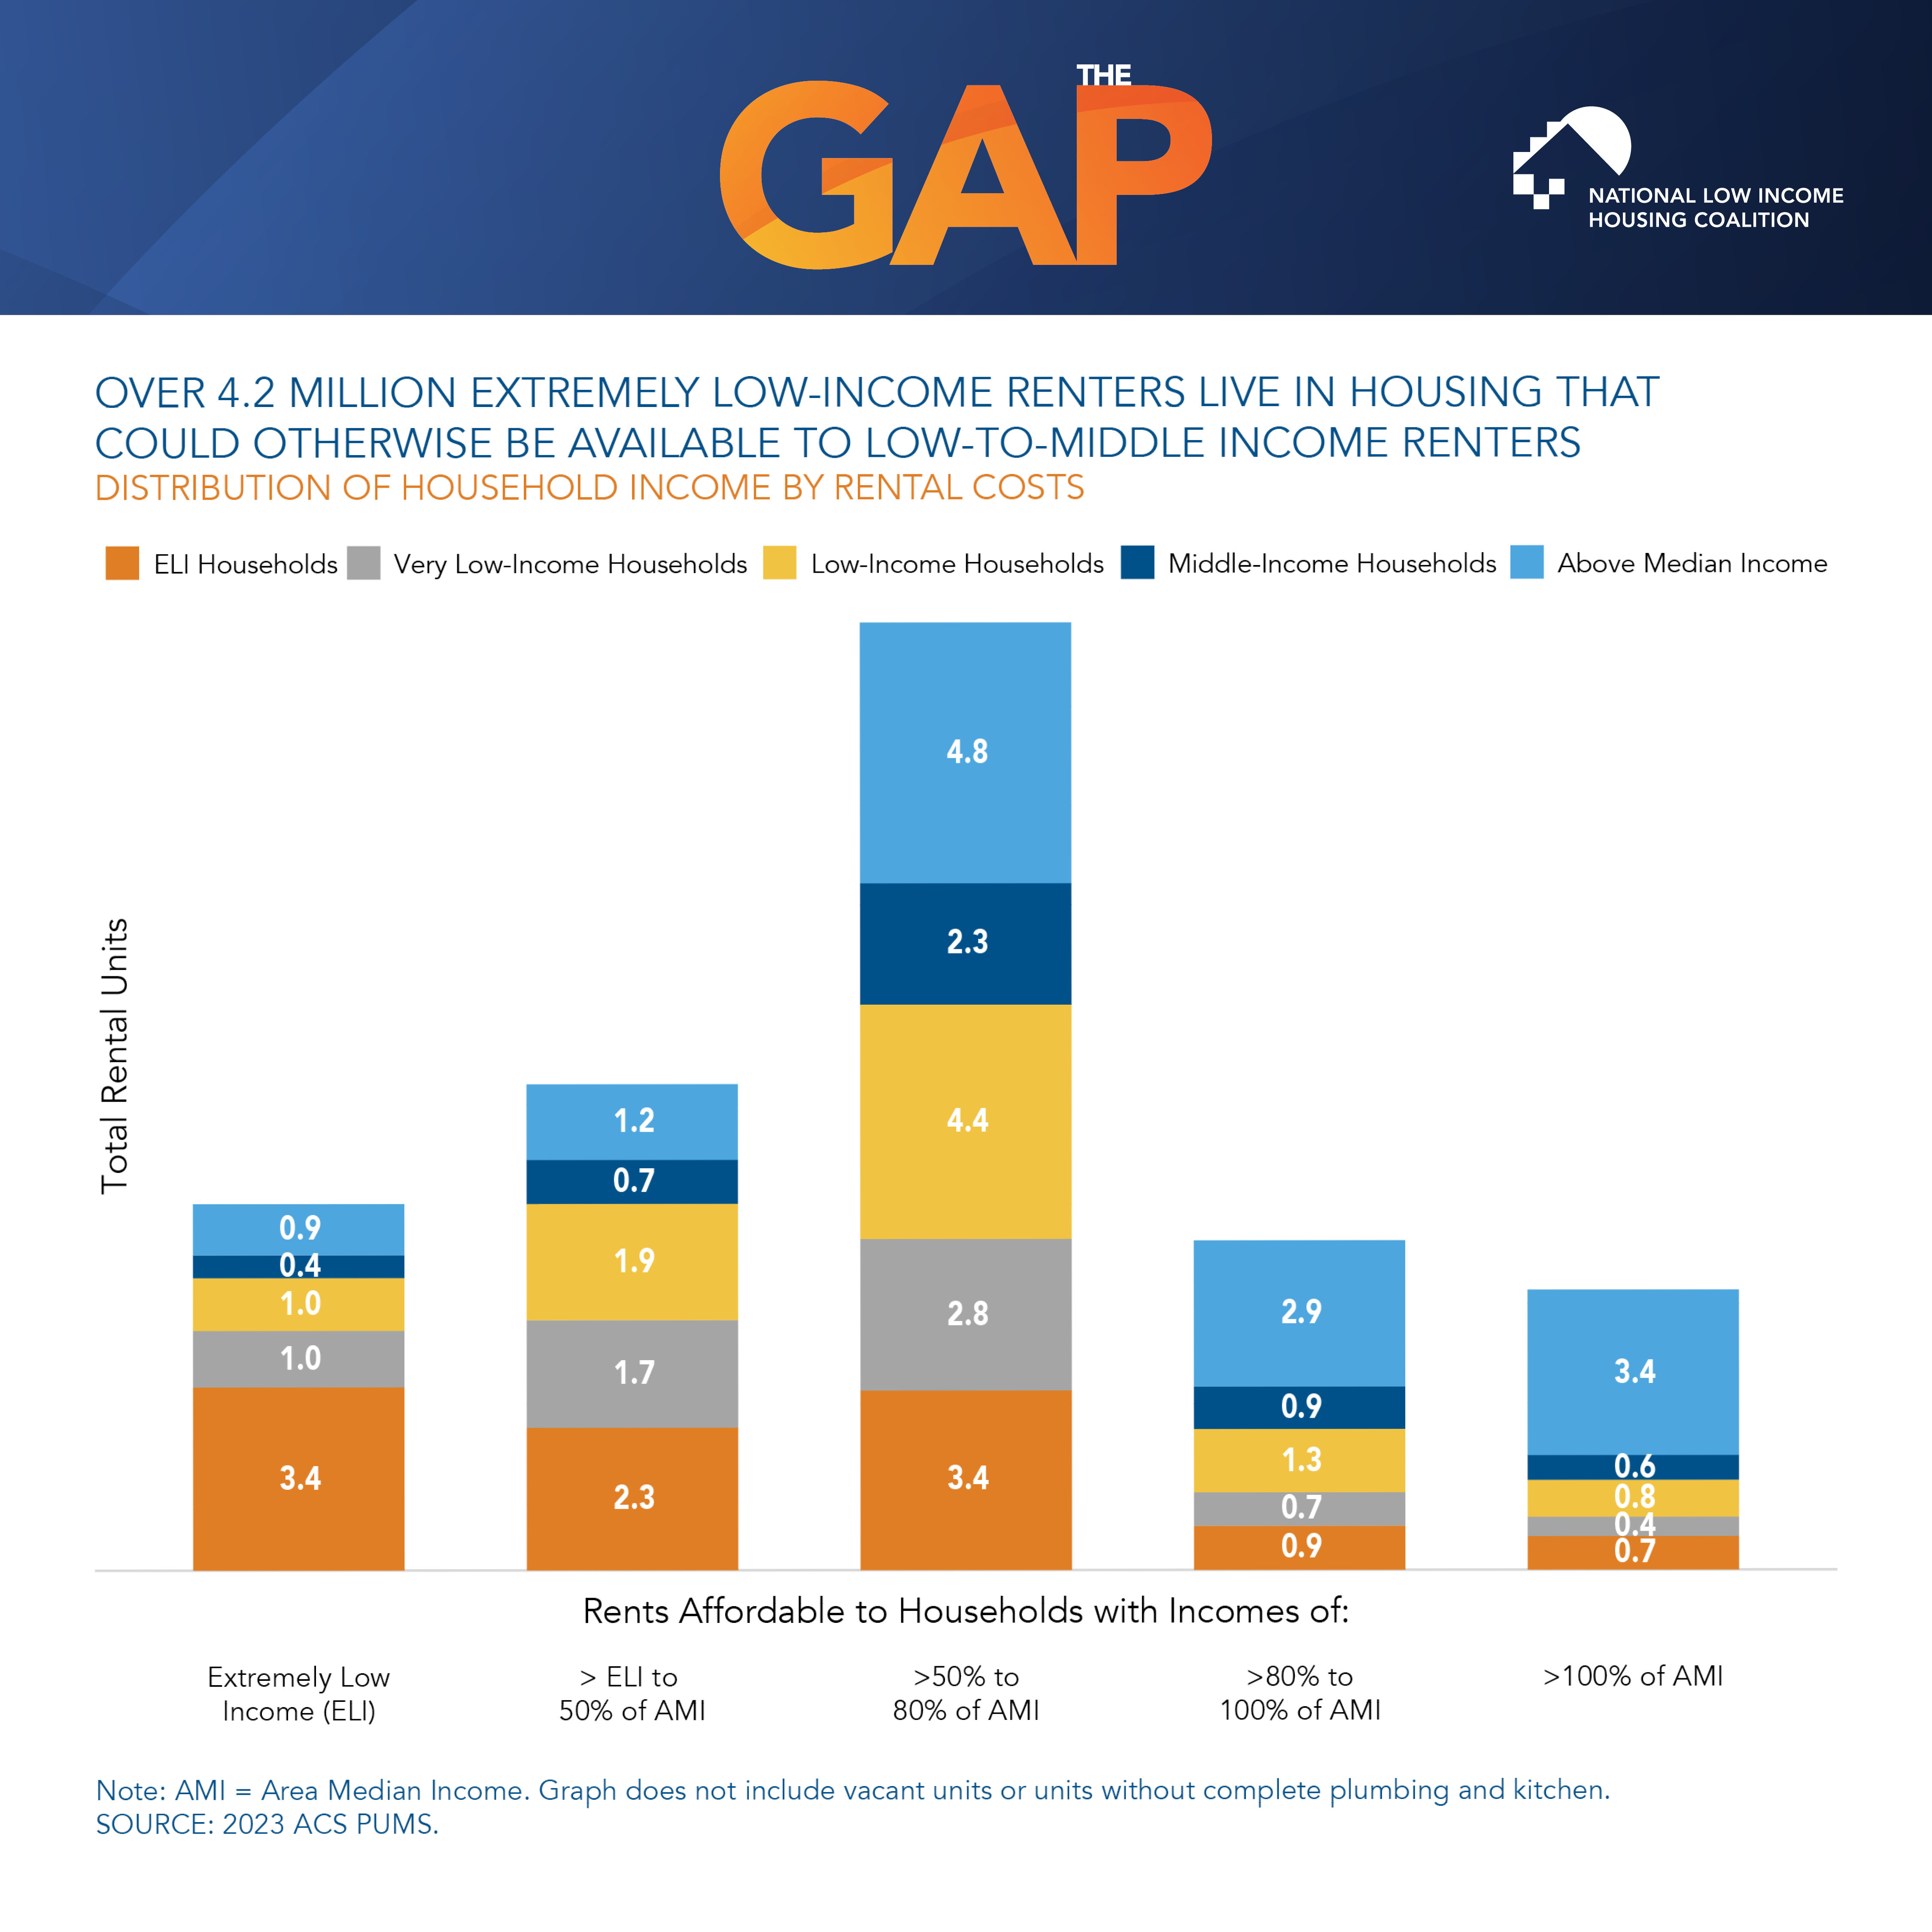
Distribution of Household Income by Rental Cost
Graph showing the distribution of renters by income into rental housing of different affordability levels. Most extremely low-income renters reside in unaffordable housing that would otherwise be affordable and available for higher-income households.
English (PNG)
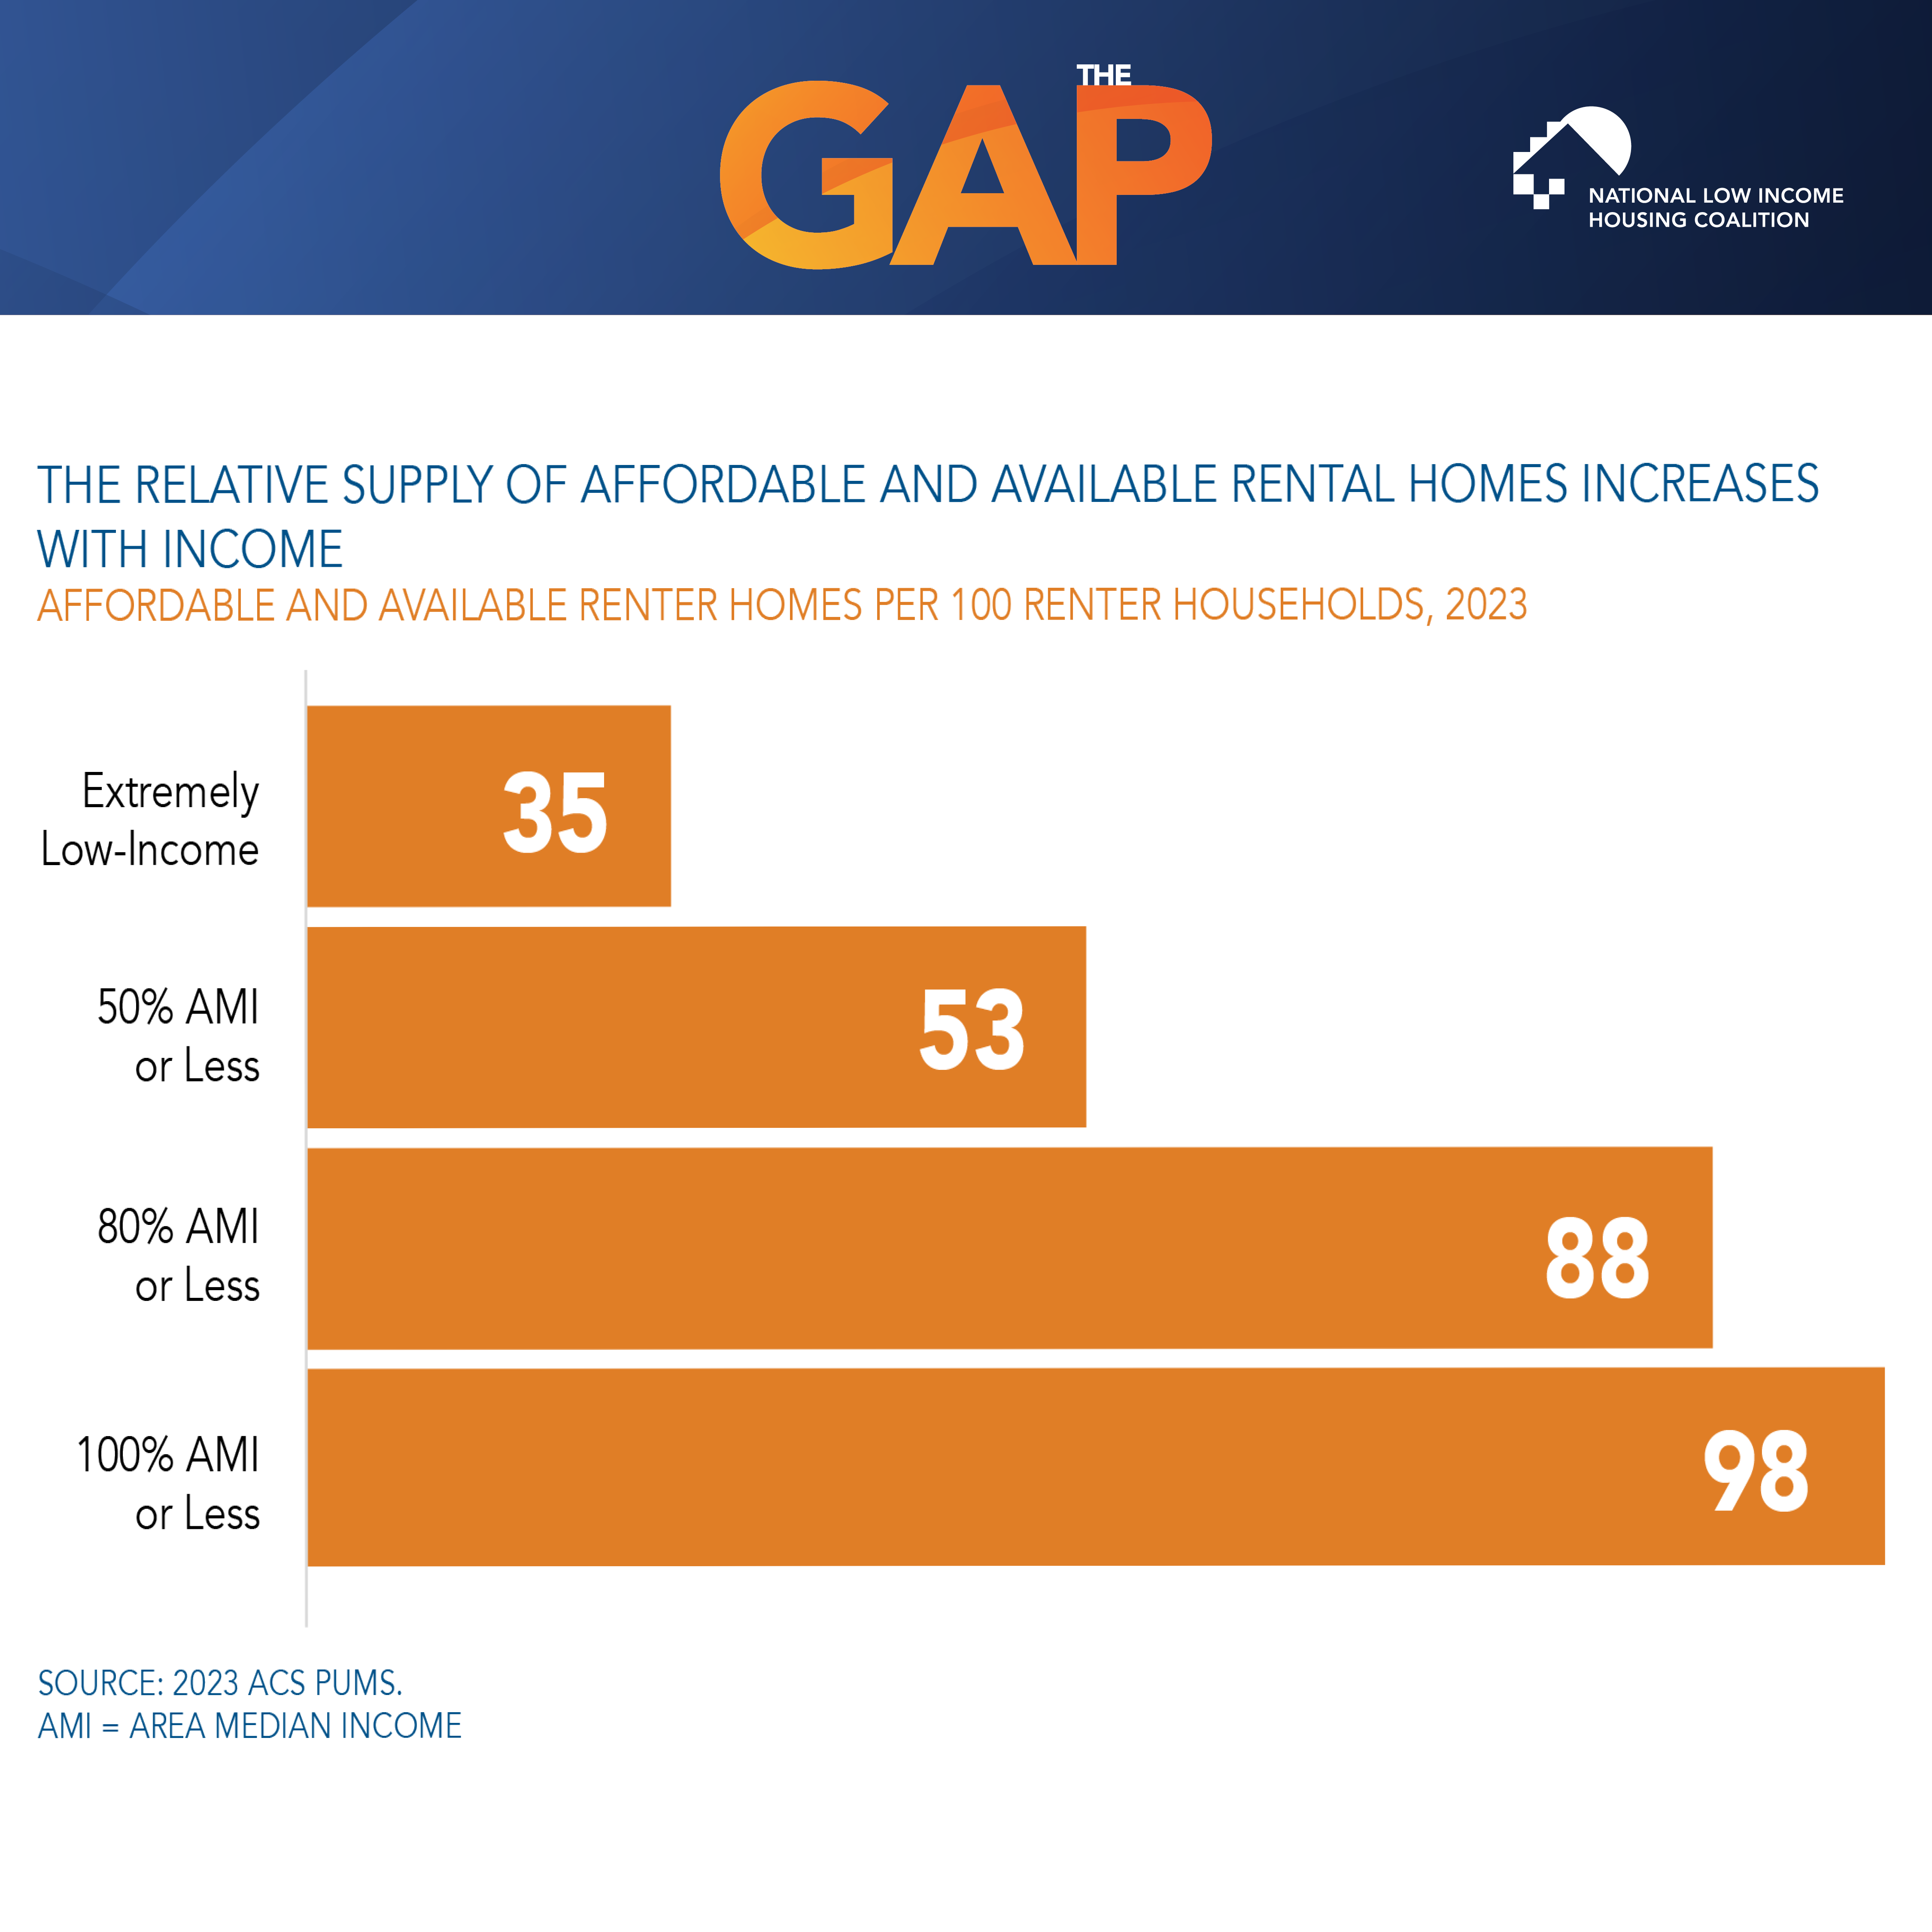
Affordable and Available Rental Homes per 100 Renter Households
Chart showing affordable and available rental homes per 100 renter households at extremely low income, 50% of Area Median Income (AMI), 80% of AMI, and 100% of AMI.
English (PNG)
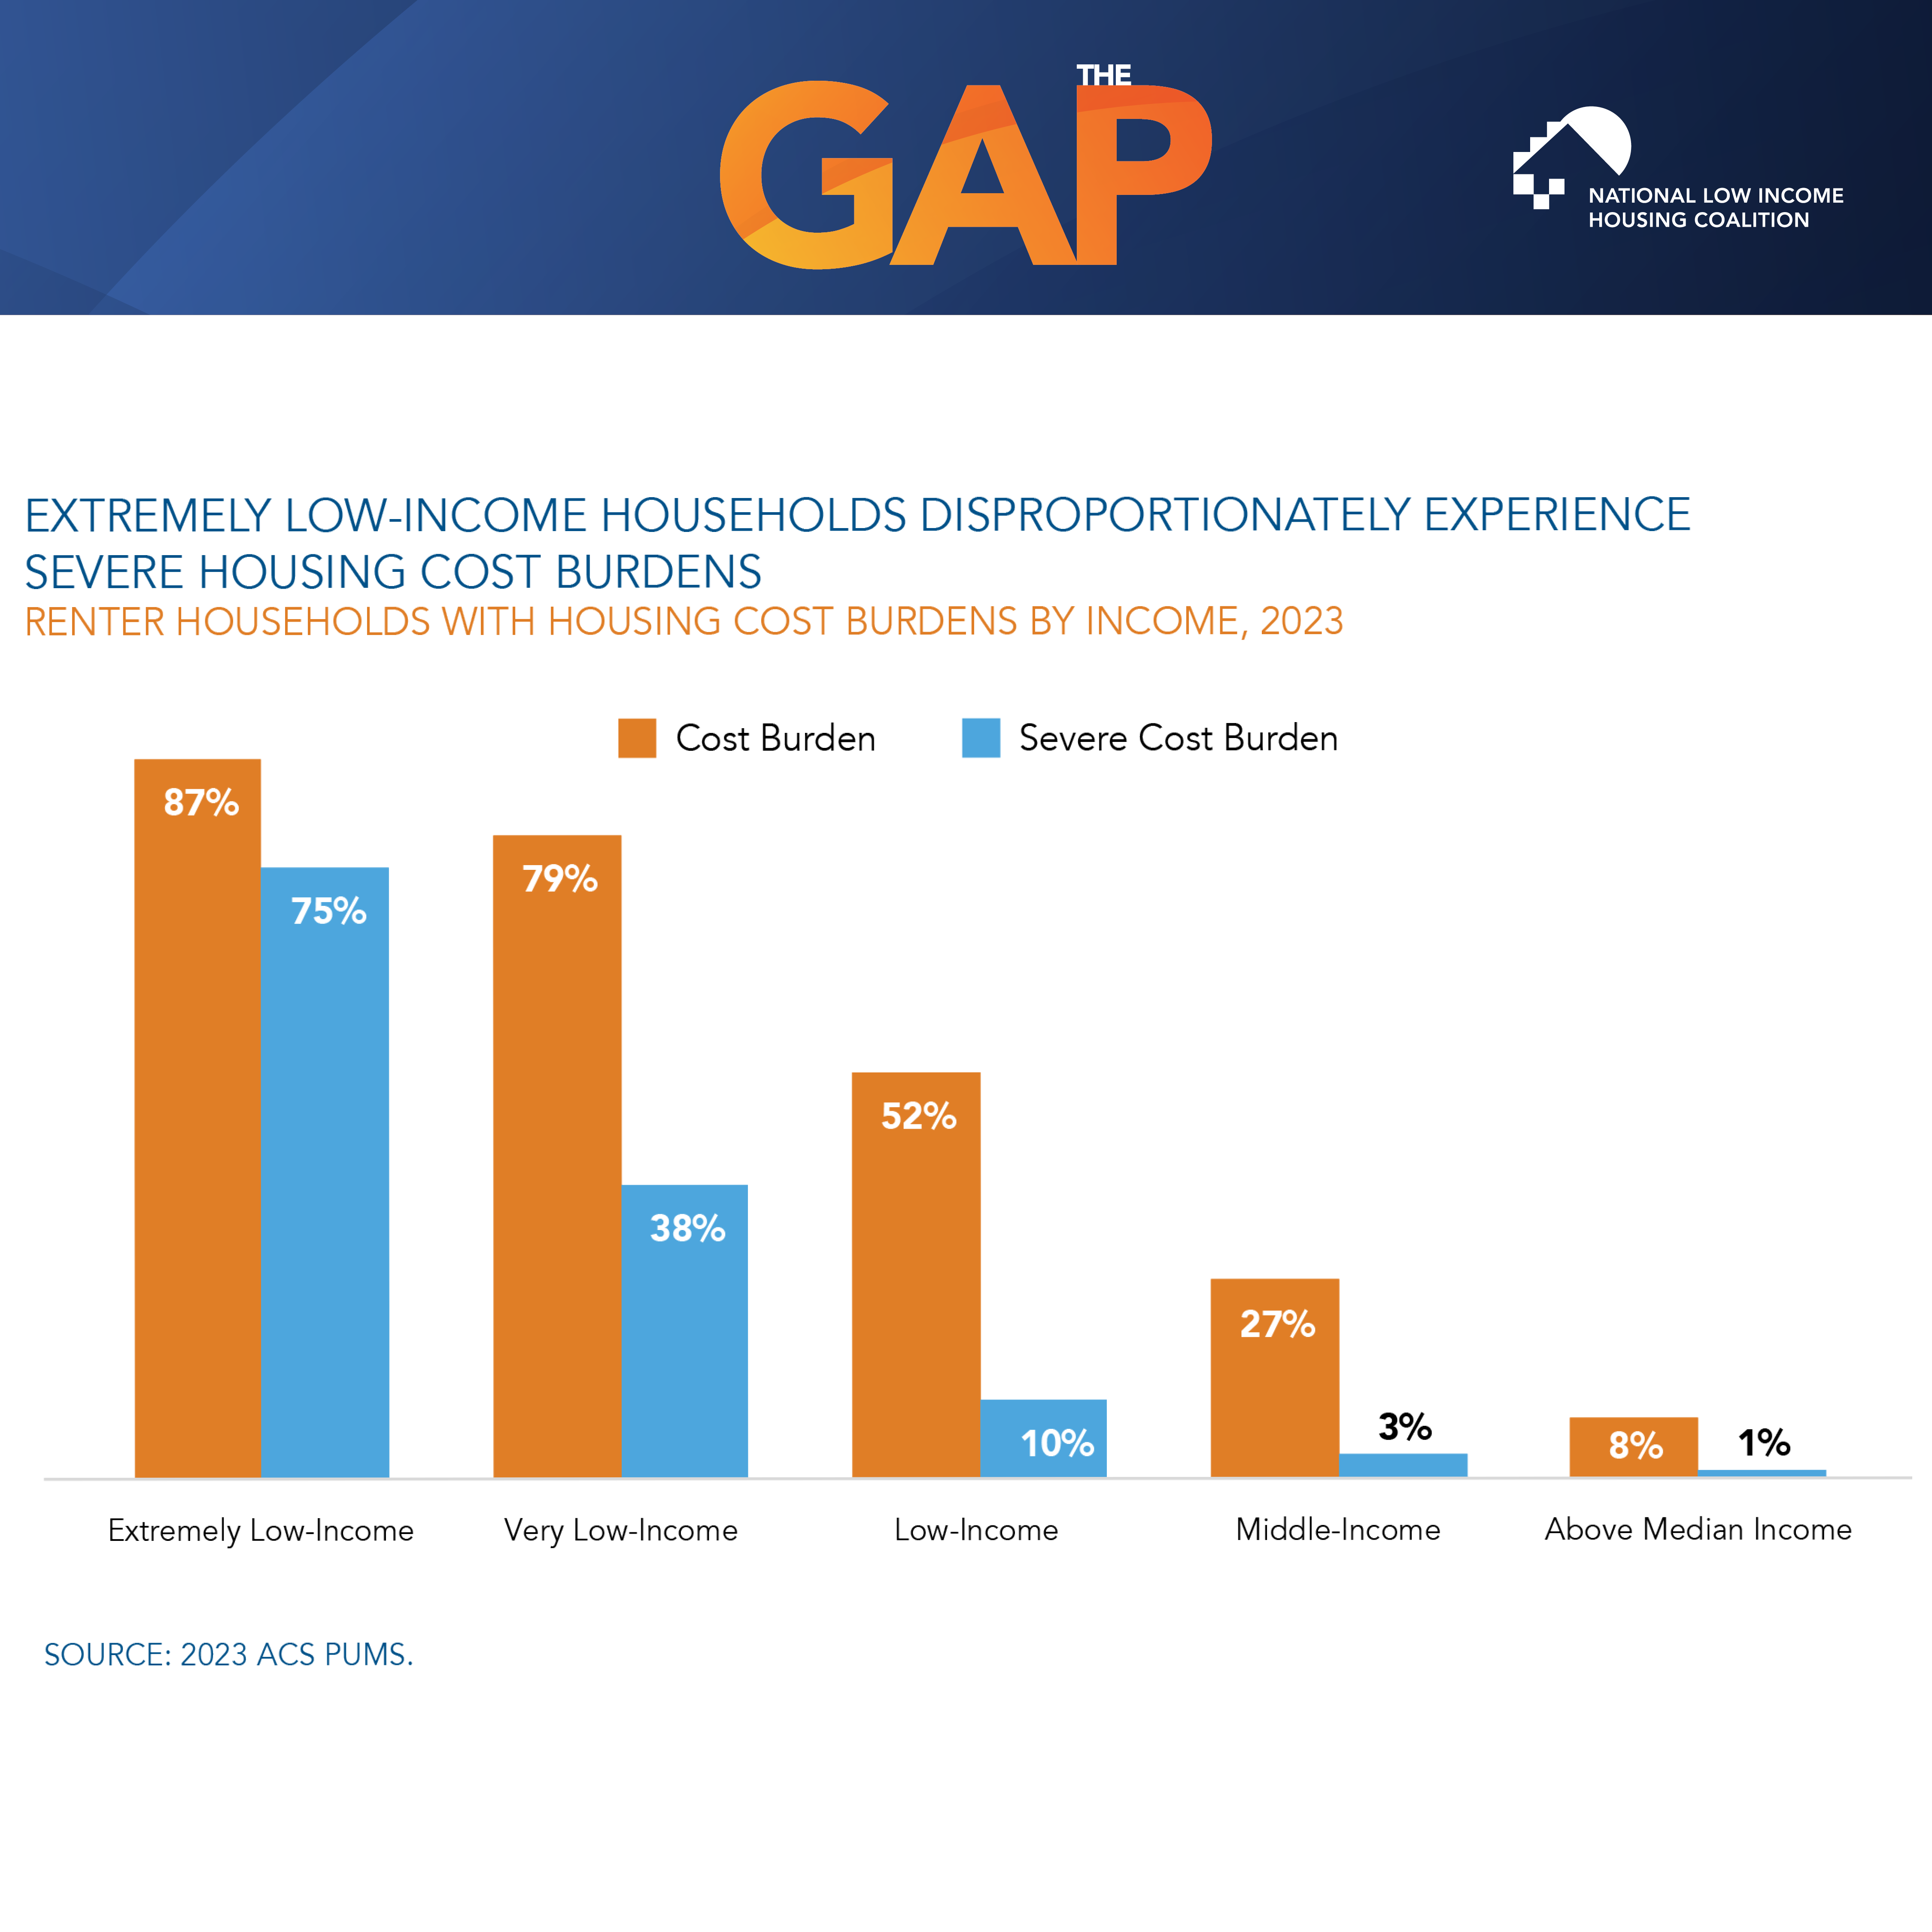
Housing Cost Burdens by Income Level
Renters with extremely low incomes are much more likely than other renters to be severely housing cost-burdened.
English (PNG)
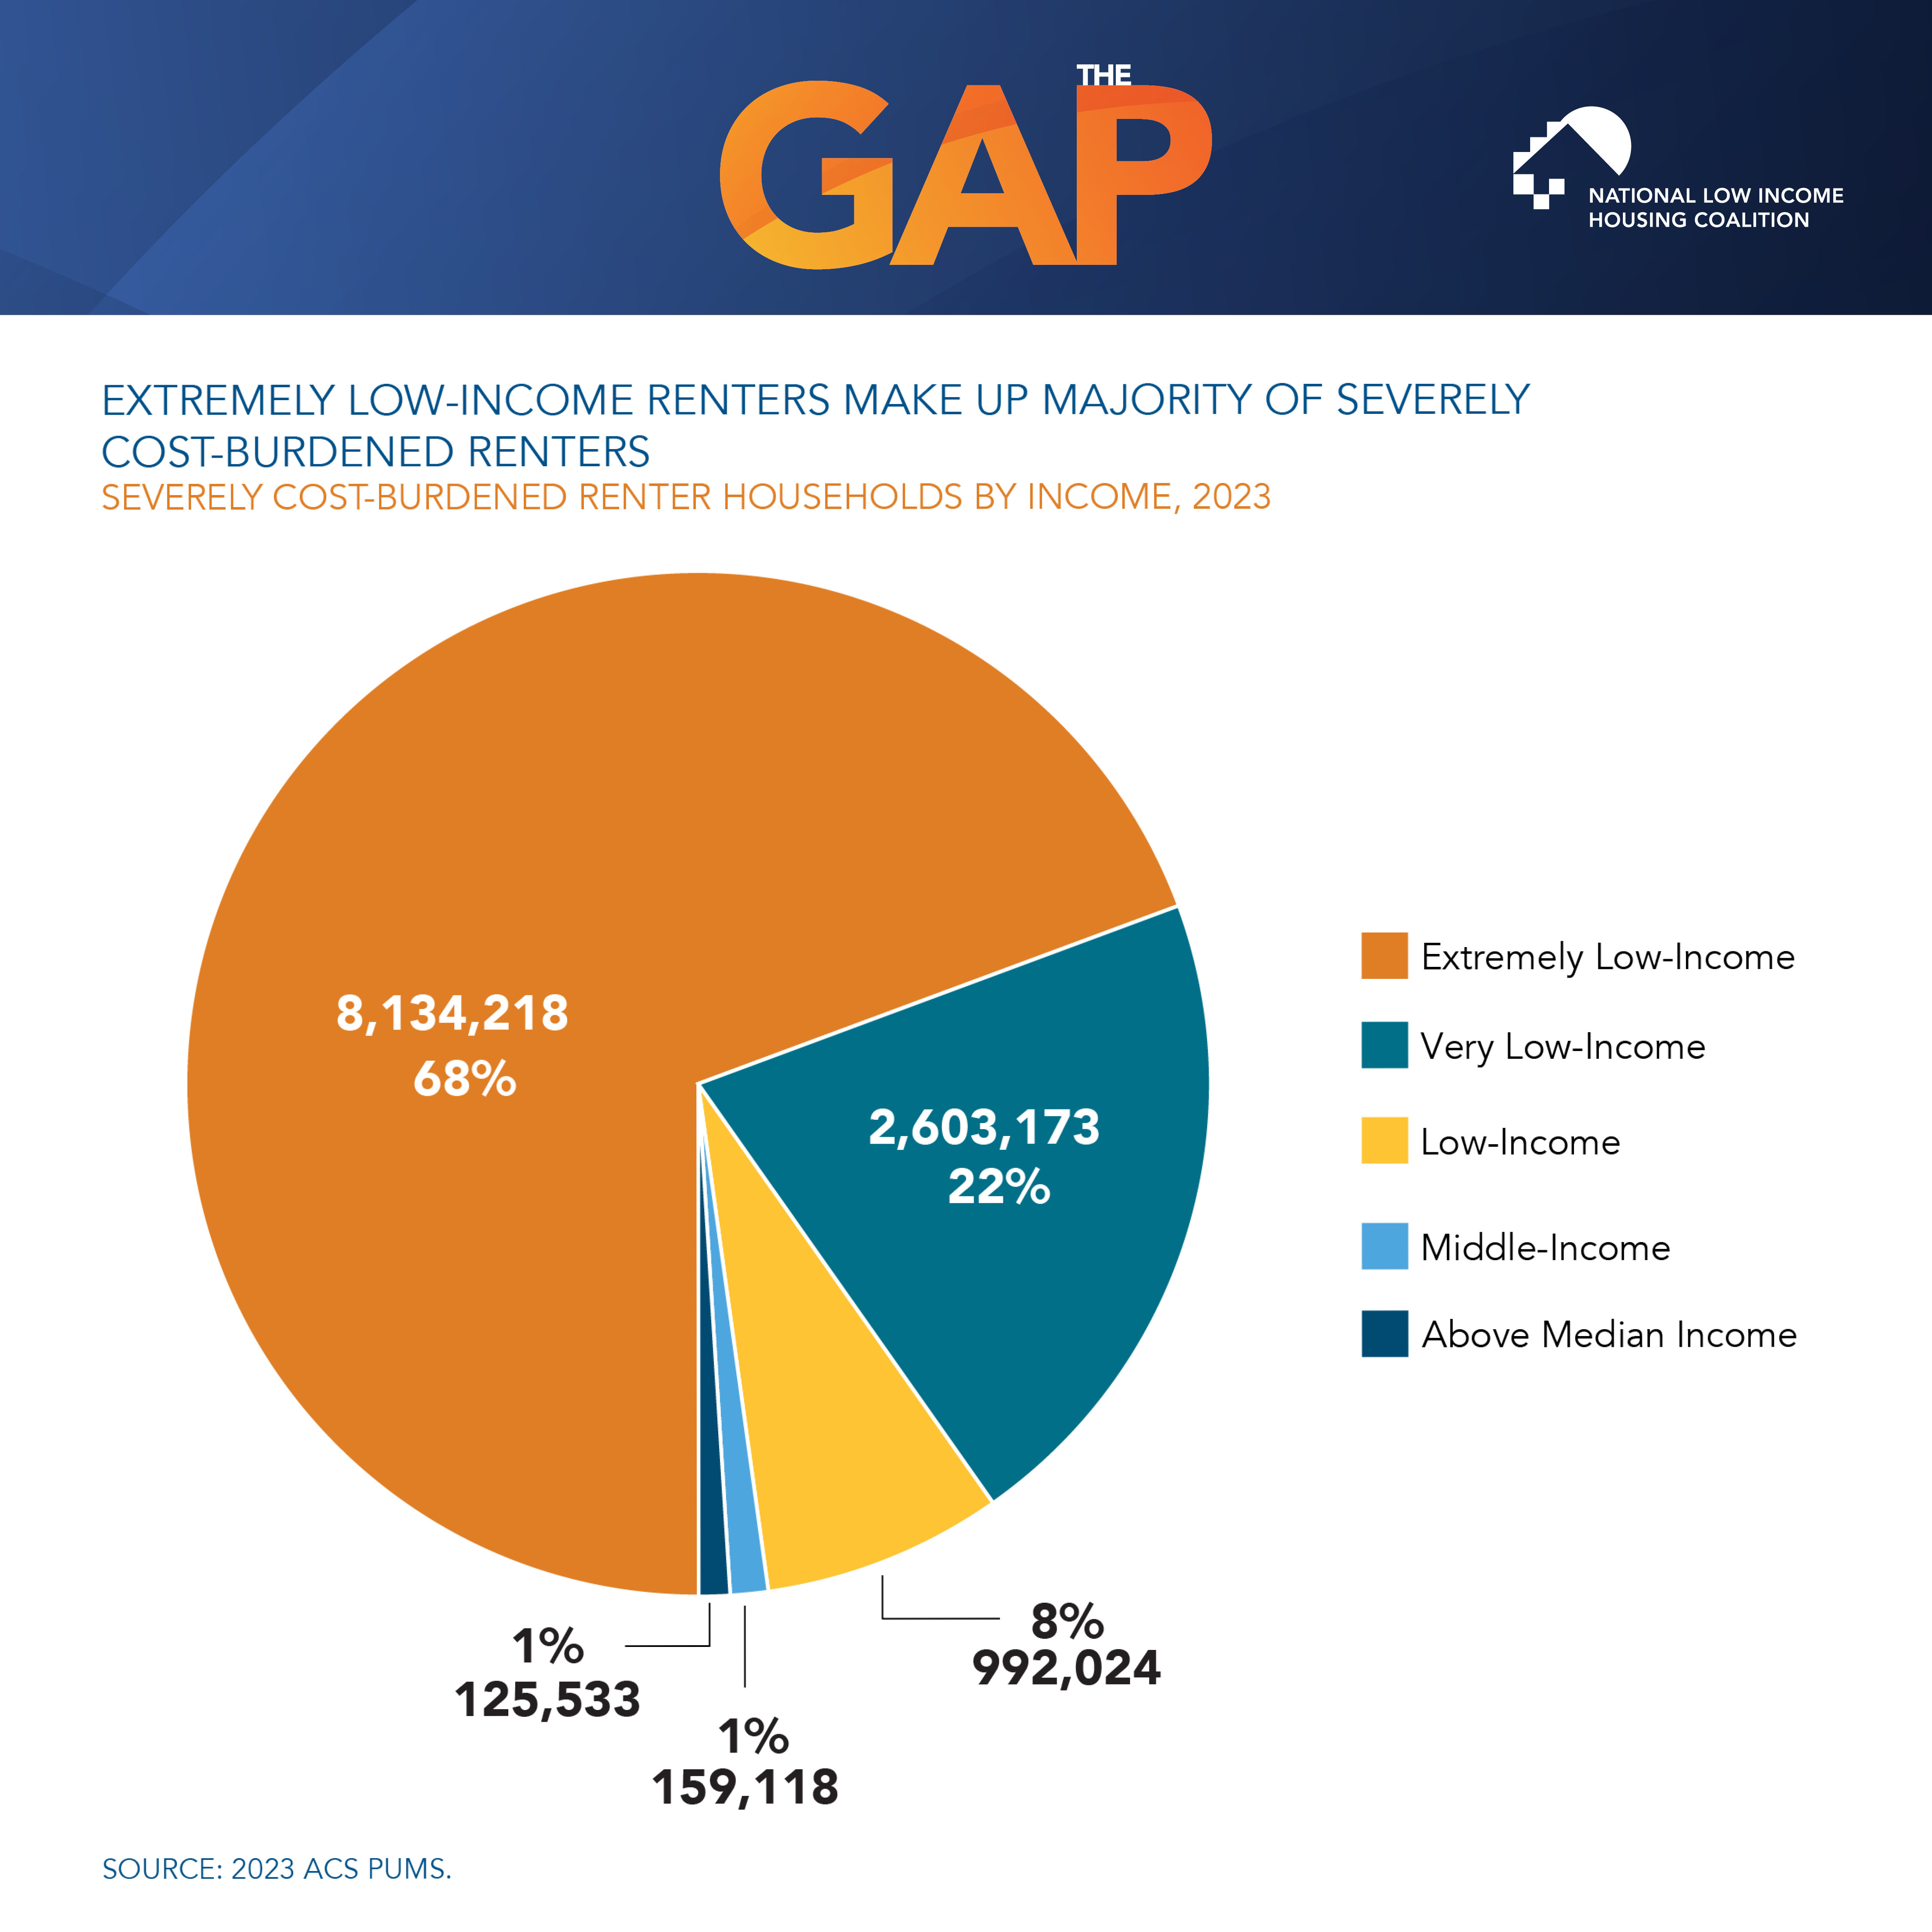
Severely Housing Cost-Burdened Renters
Renters with extremely low incomes account for most severely cost-burdened renters in the U.S.
English (PNG)
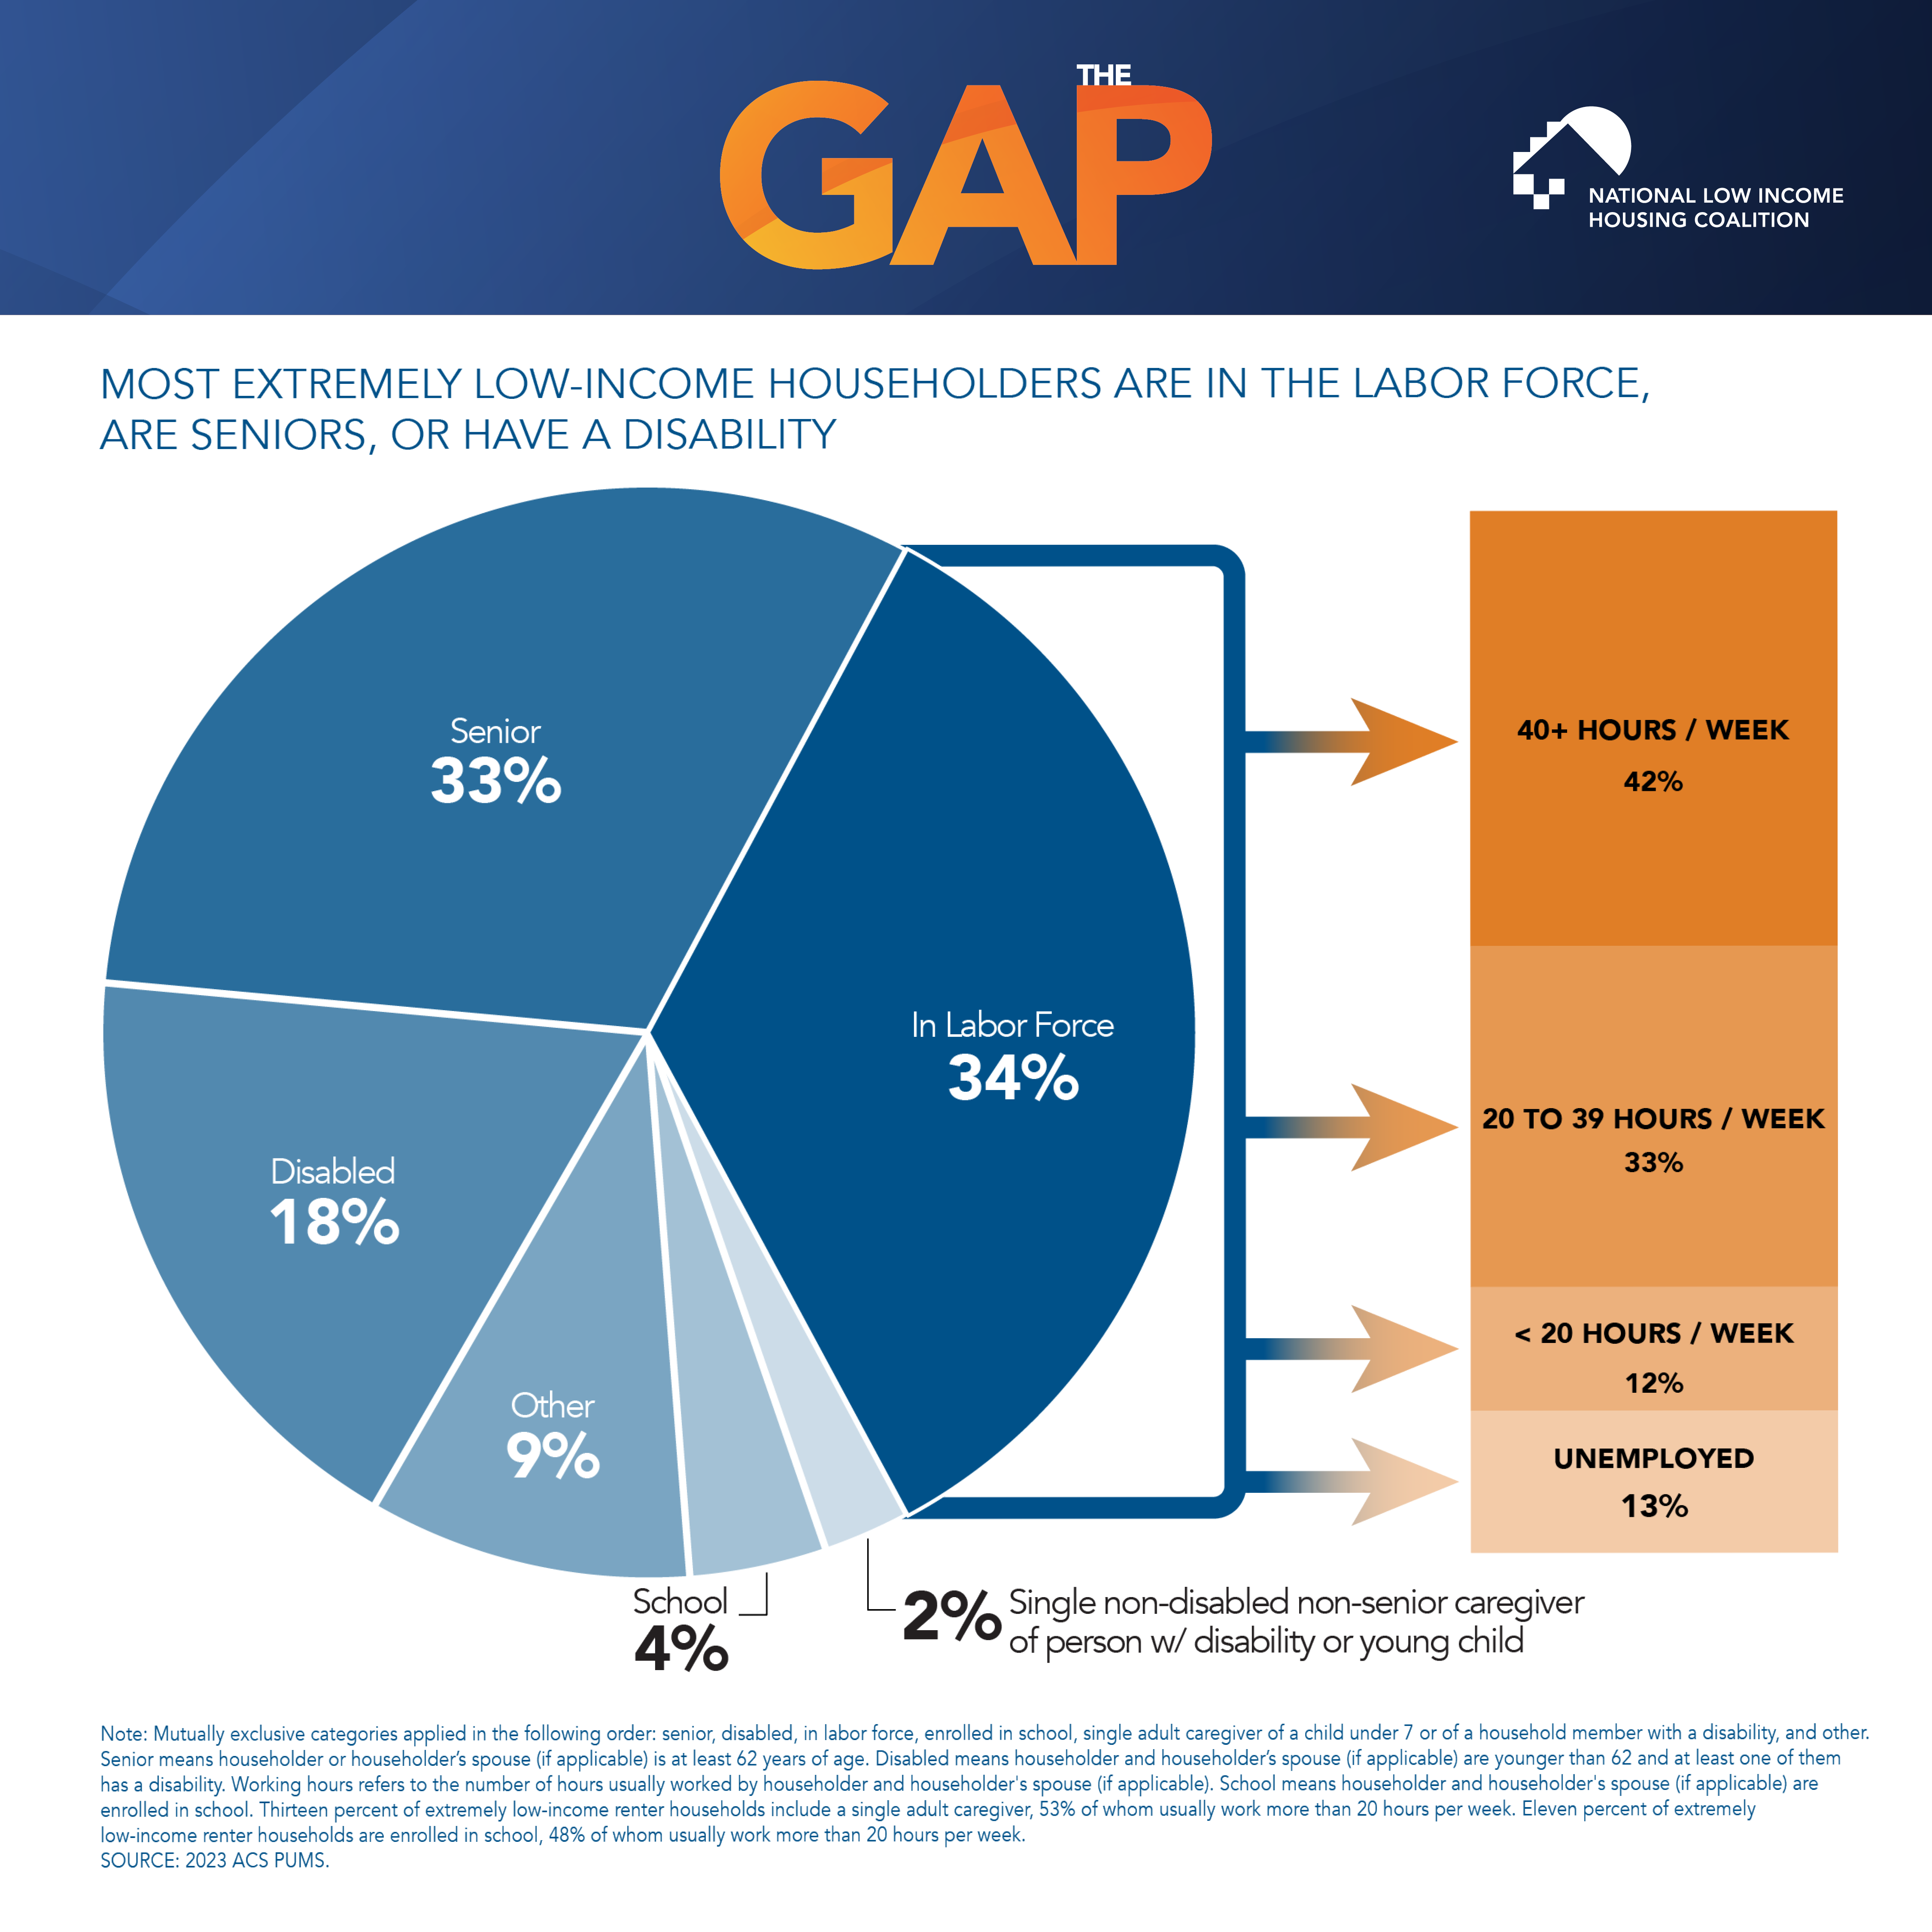
Who are Extremely Low-Income Renters?
Fifty-one percent of extremely low-income renter households are seniors or people with disabilities and another 40% are in the labor force, in school, or single-adult caregivers of school-aged children or family members with disabilities.
English (PNG)
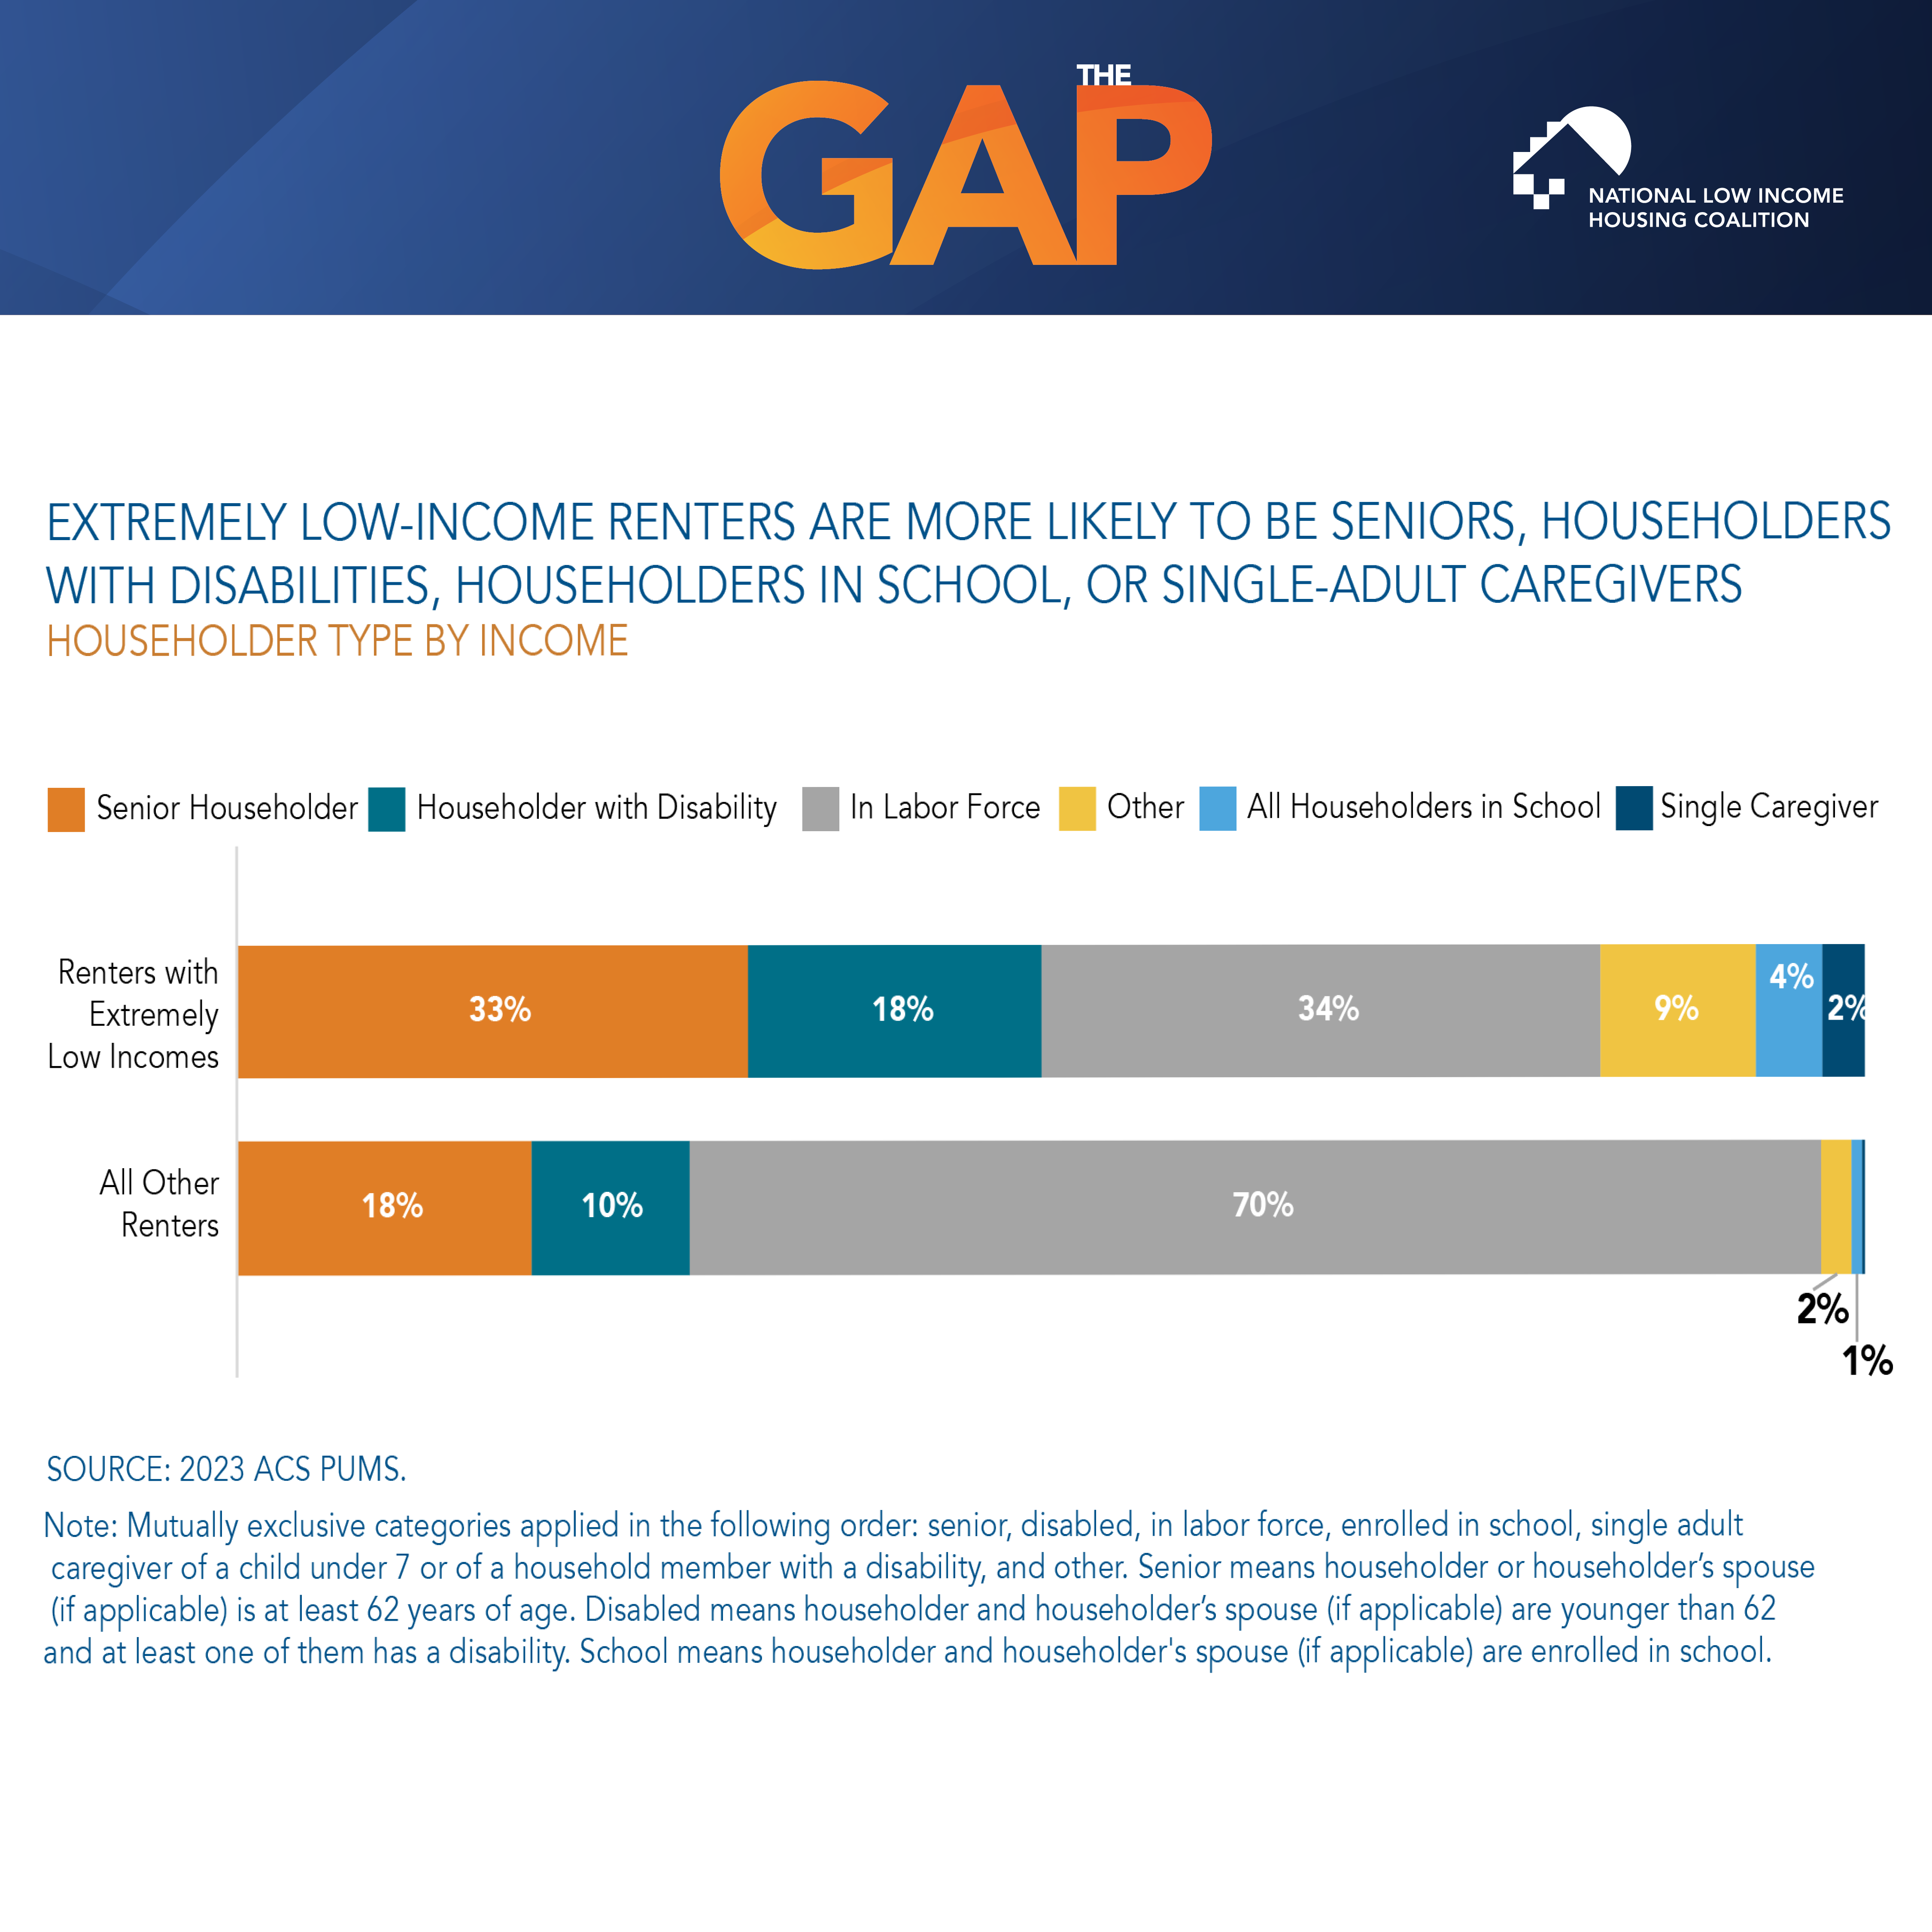
Extremely Low-Income Renter Characteristics that Constrain Income
Extremely low-income renters are more likely than other renters to have characteristics that limit the hours that they are able to work: they are more likely than all other renters to be seniors, have a disability, be enrolled in school, or be single-adult caregivers of children or individuals with a disability.
English (PNG)
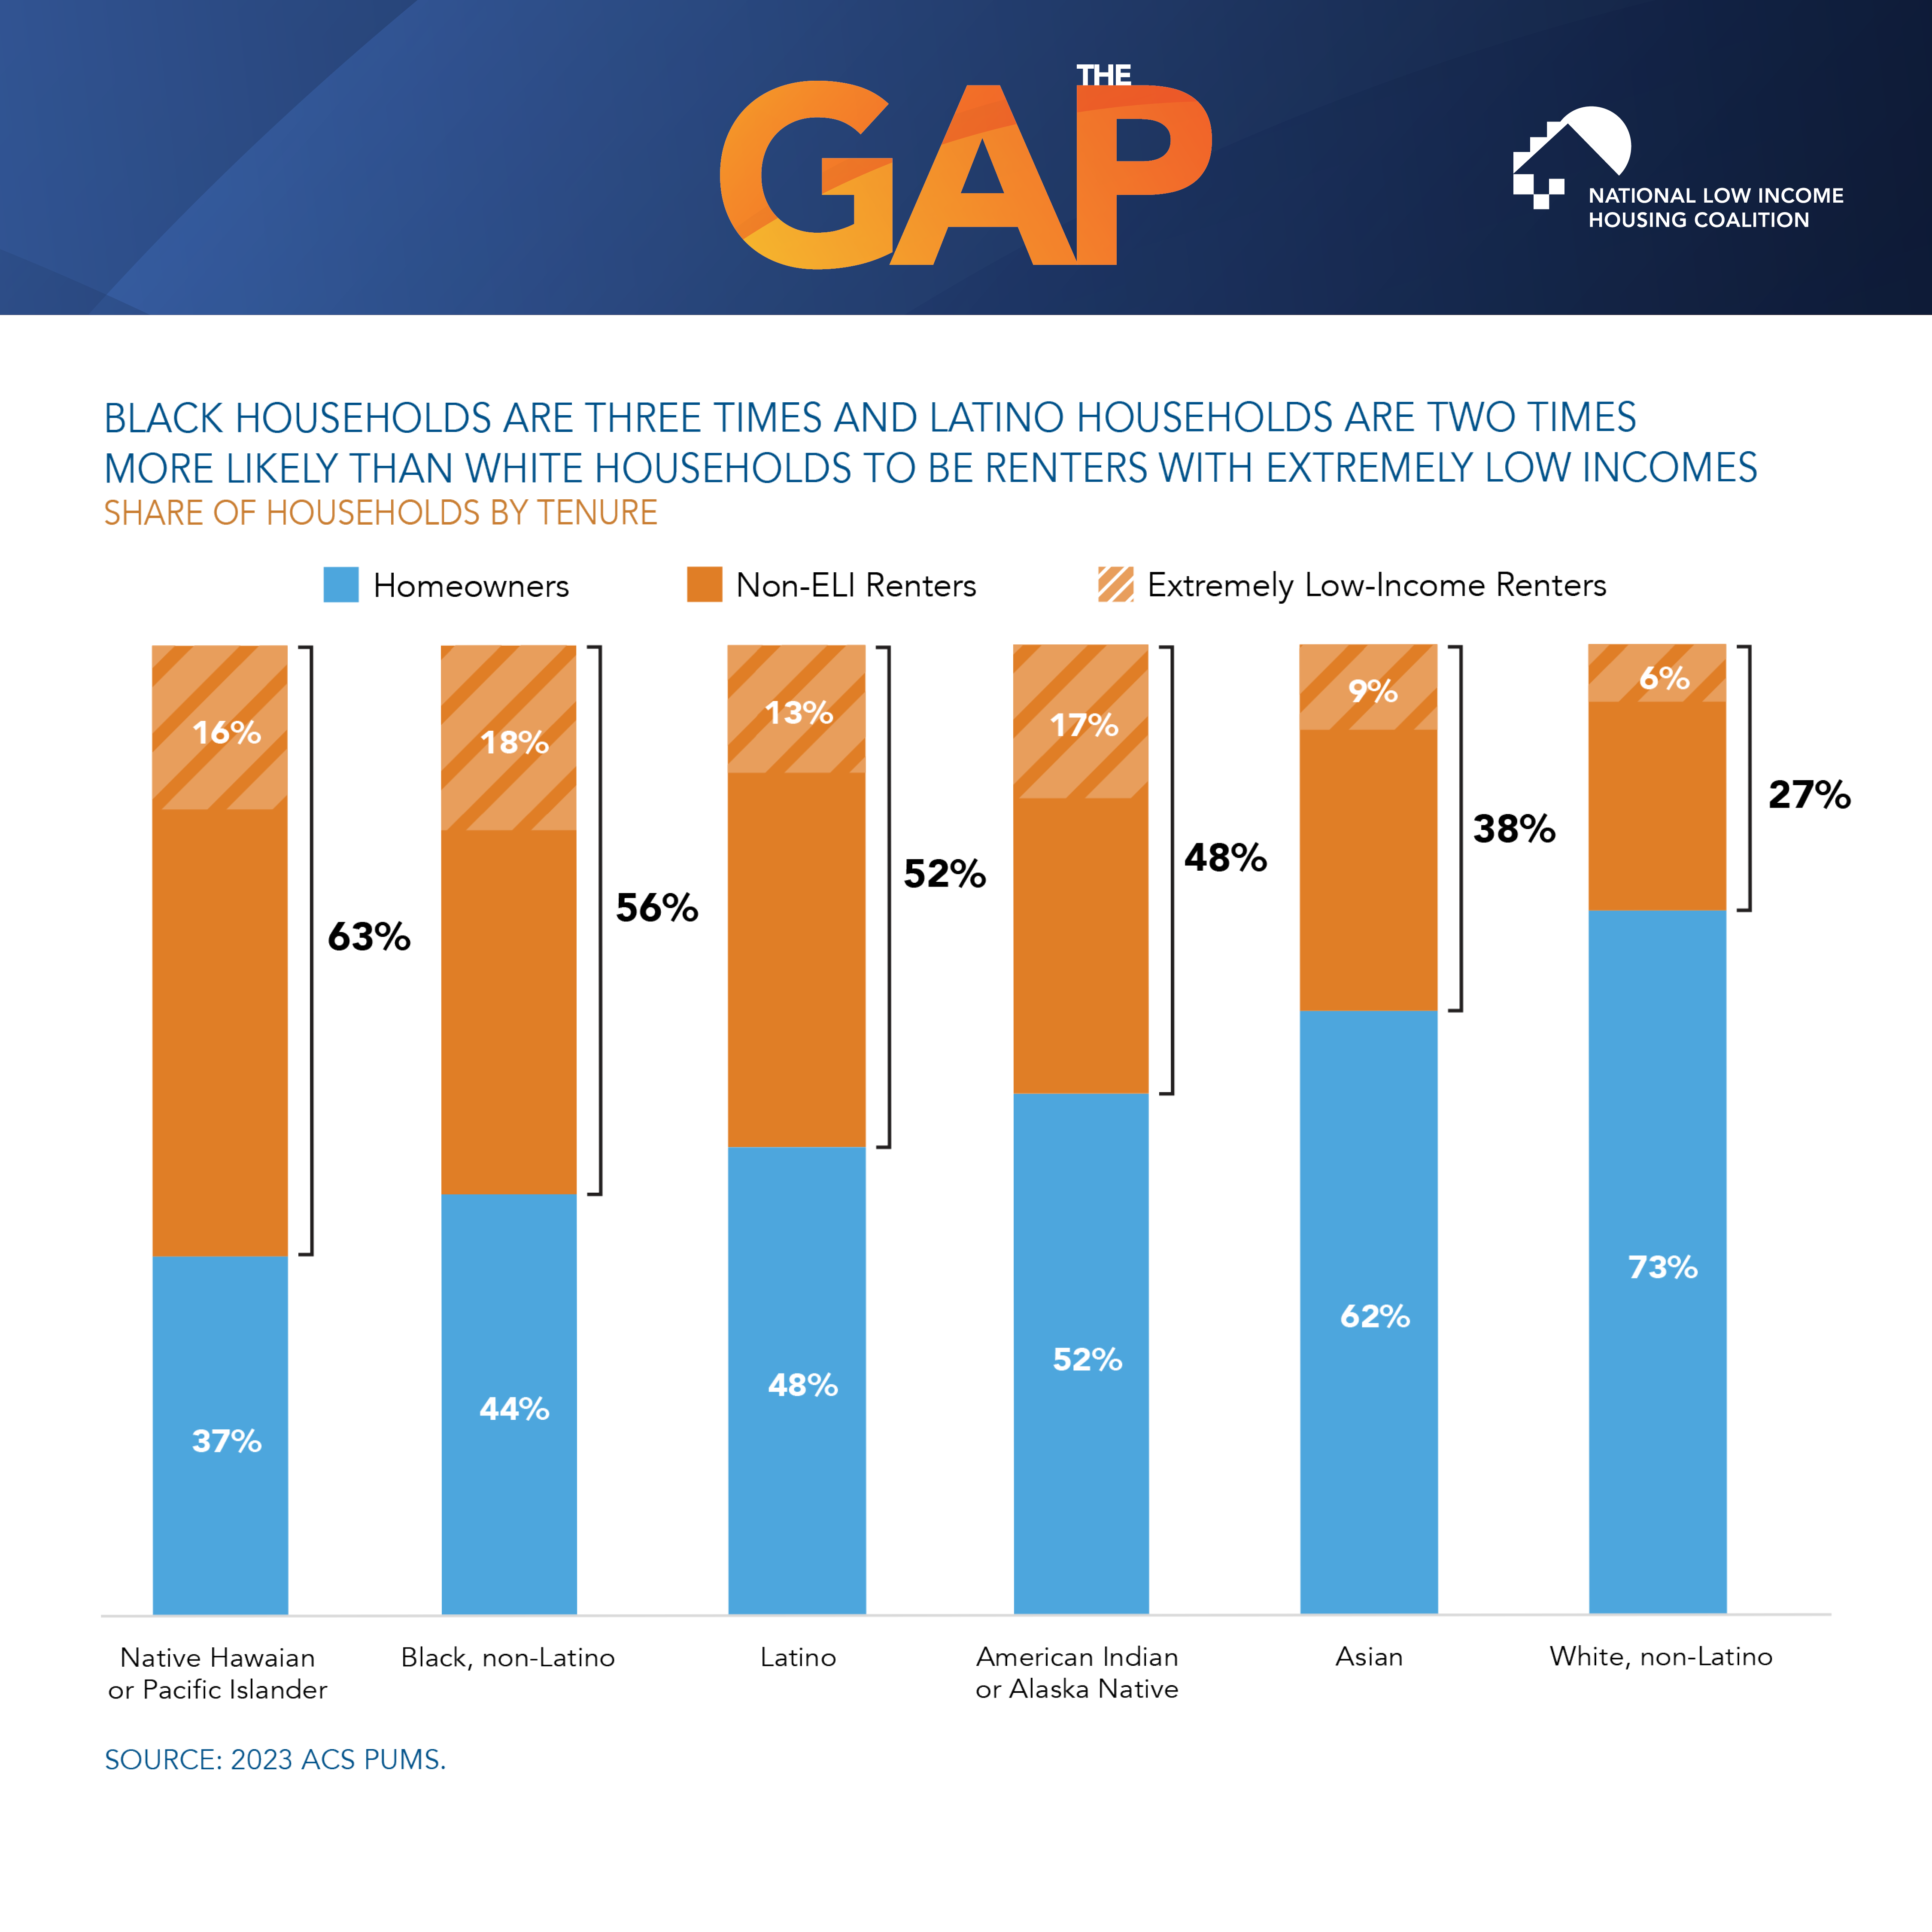
Share of Households by Tenure and Race
Black, Latino, and American Indian and Alaska Native households are more likely than white households to be renters with extremely low incomes.
English (PNG)
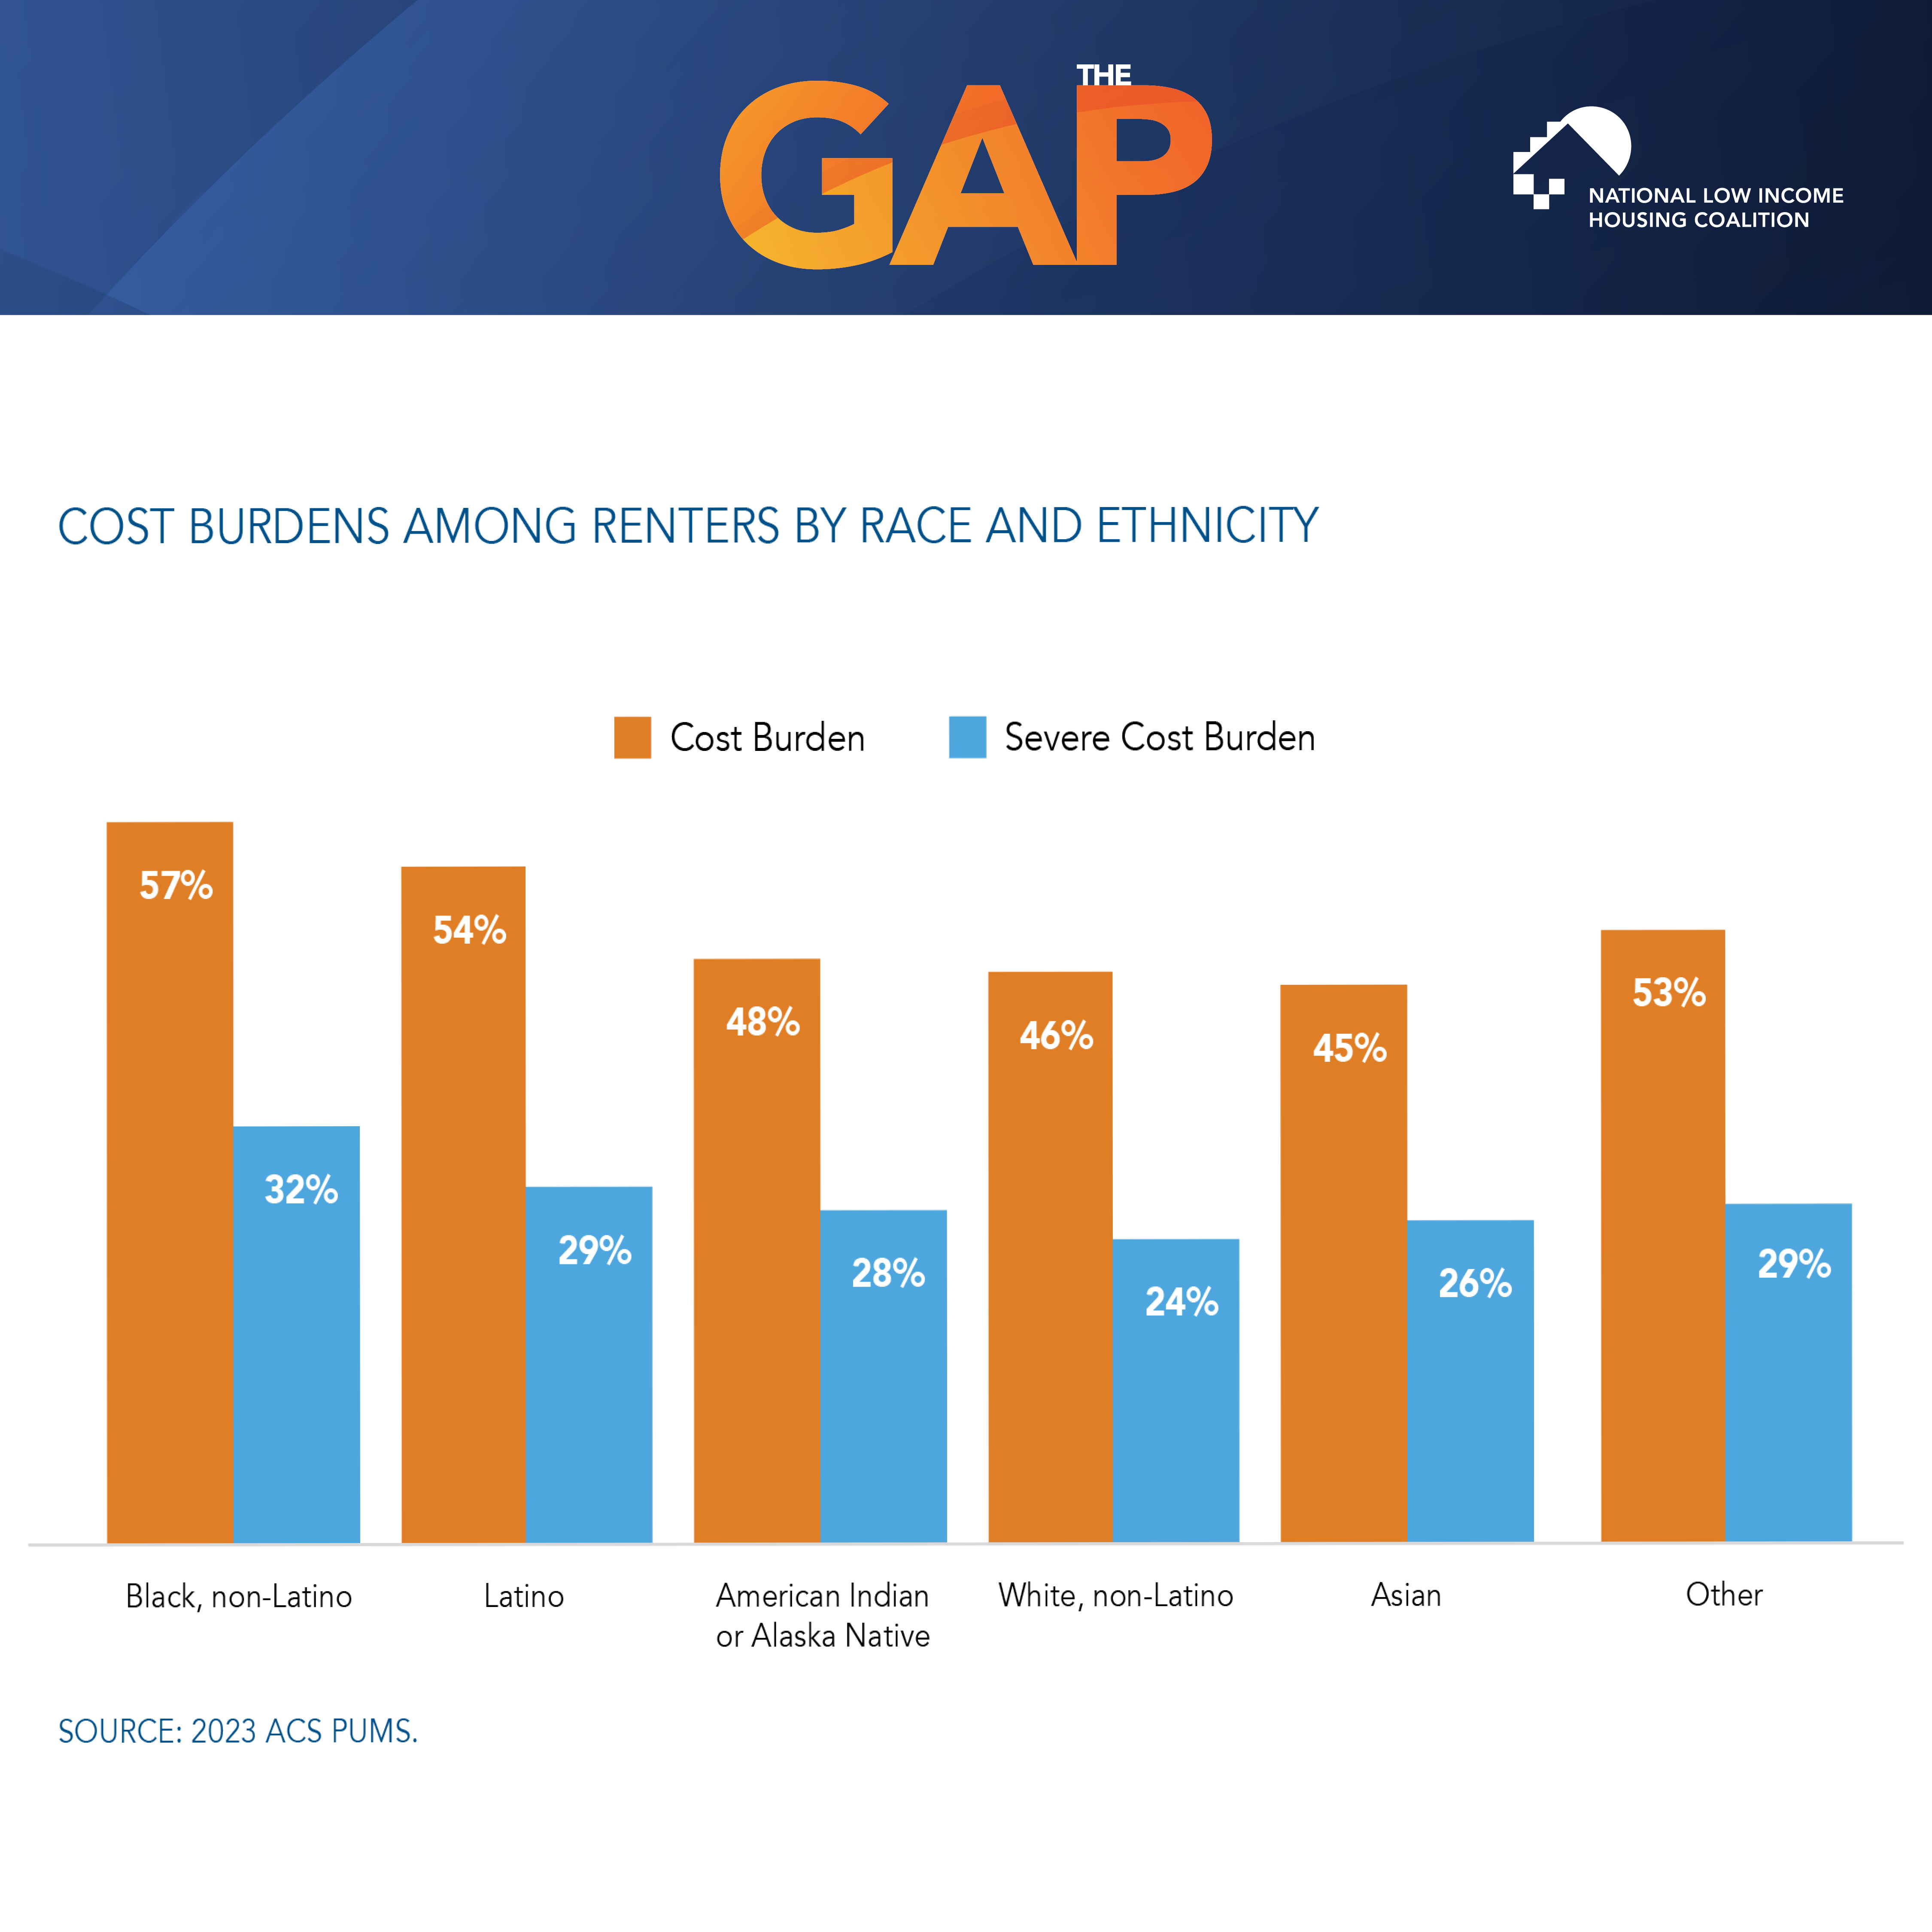
Renter Household Cost Burdens by Race and Ethnicity
Renter households of color are more likely to be housing cost-burdened or severely housing cost-burdened than white renter households.
English (PNG)
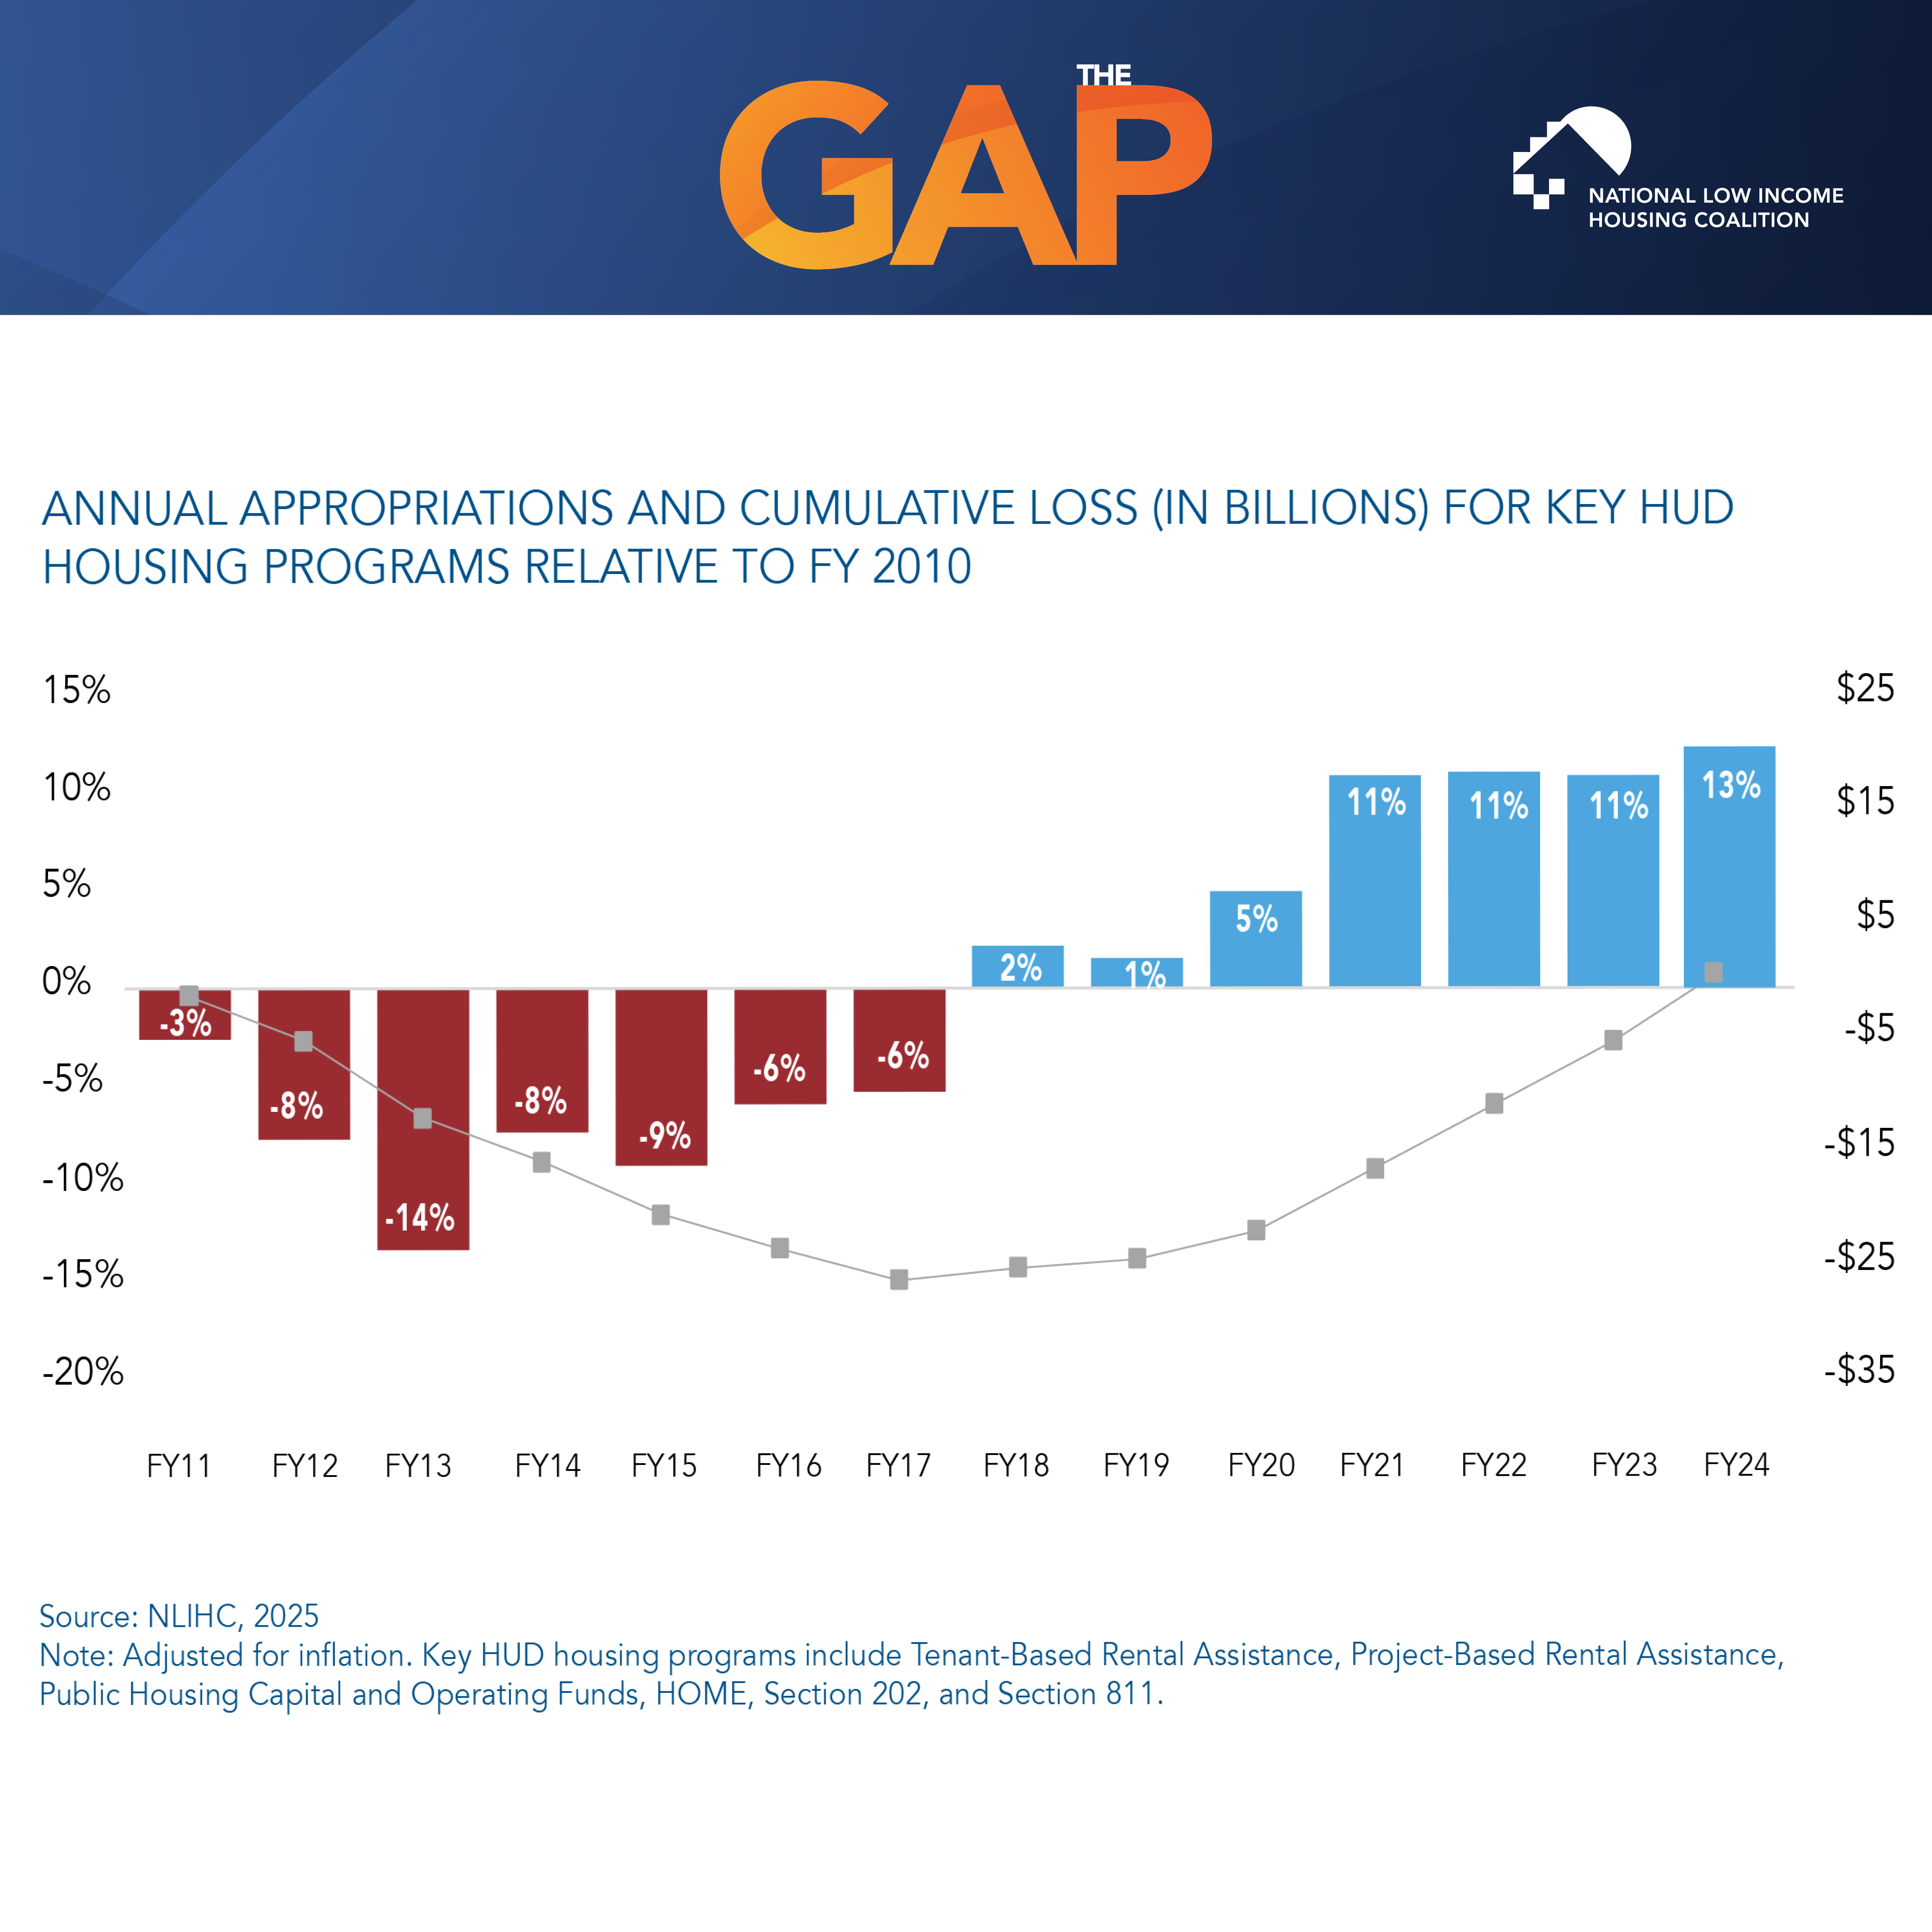
Spending Caps Have Long-Term Negative Impacts on HUD Programs
This chart shows the cumulative impact of spending caps imposed by the “Budget Control Act of 2011” (BCA) on appropriations for key HUD programs. FY2024 marked the first year when cumulative appropriations for key HUD programs equaled or exceeded what they would have been if funding had continued at FY2010 levels without the BCA.
English (PNG)
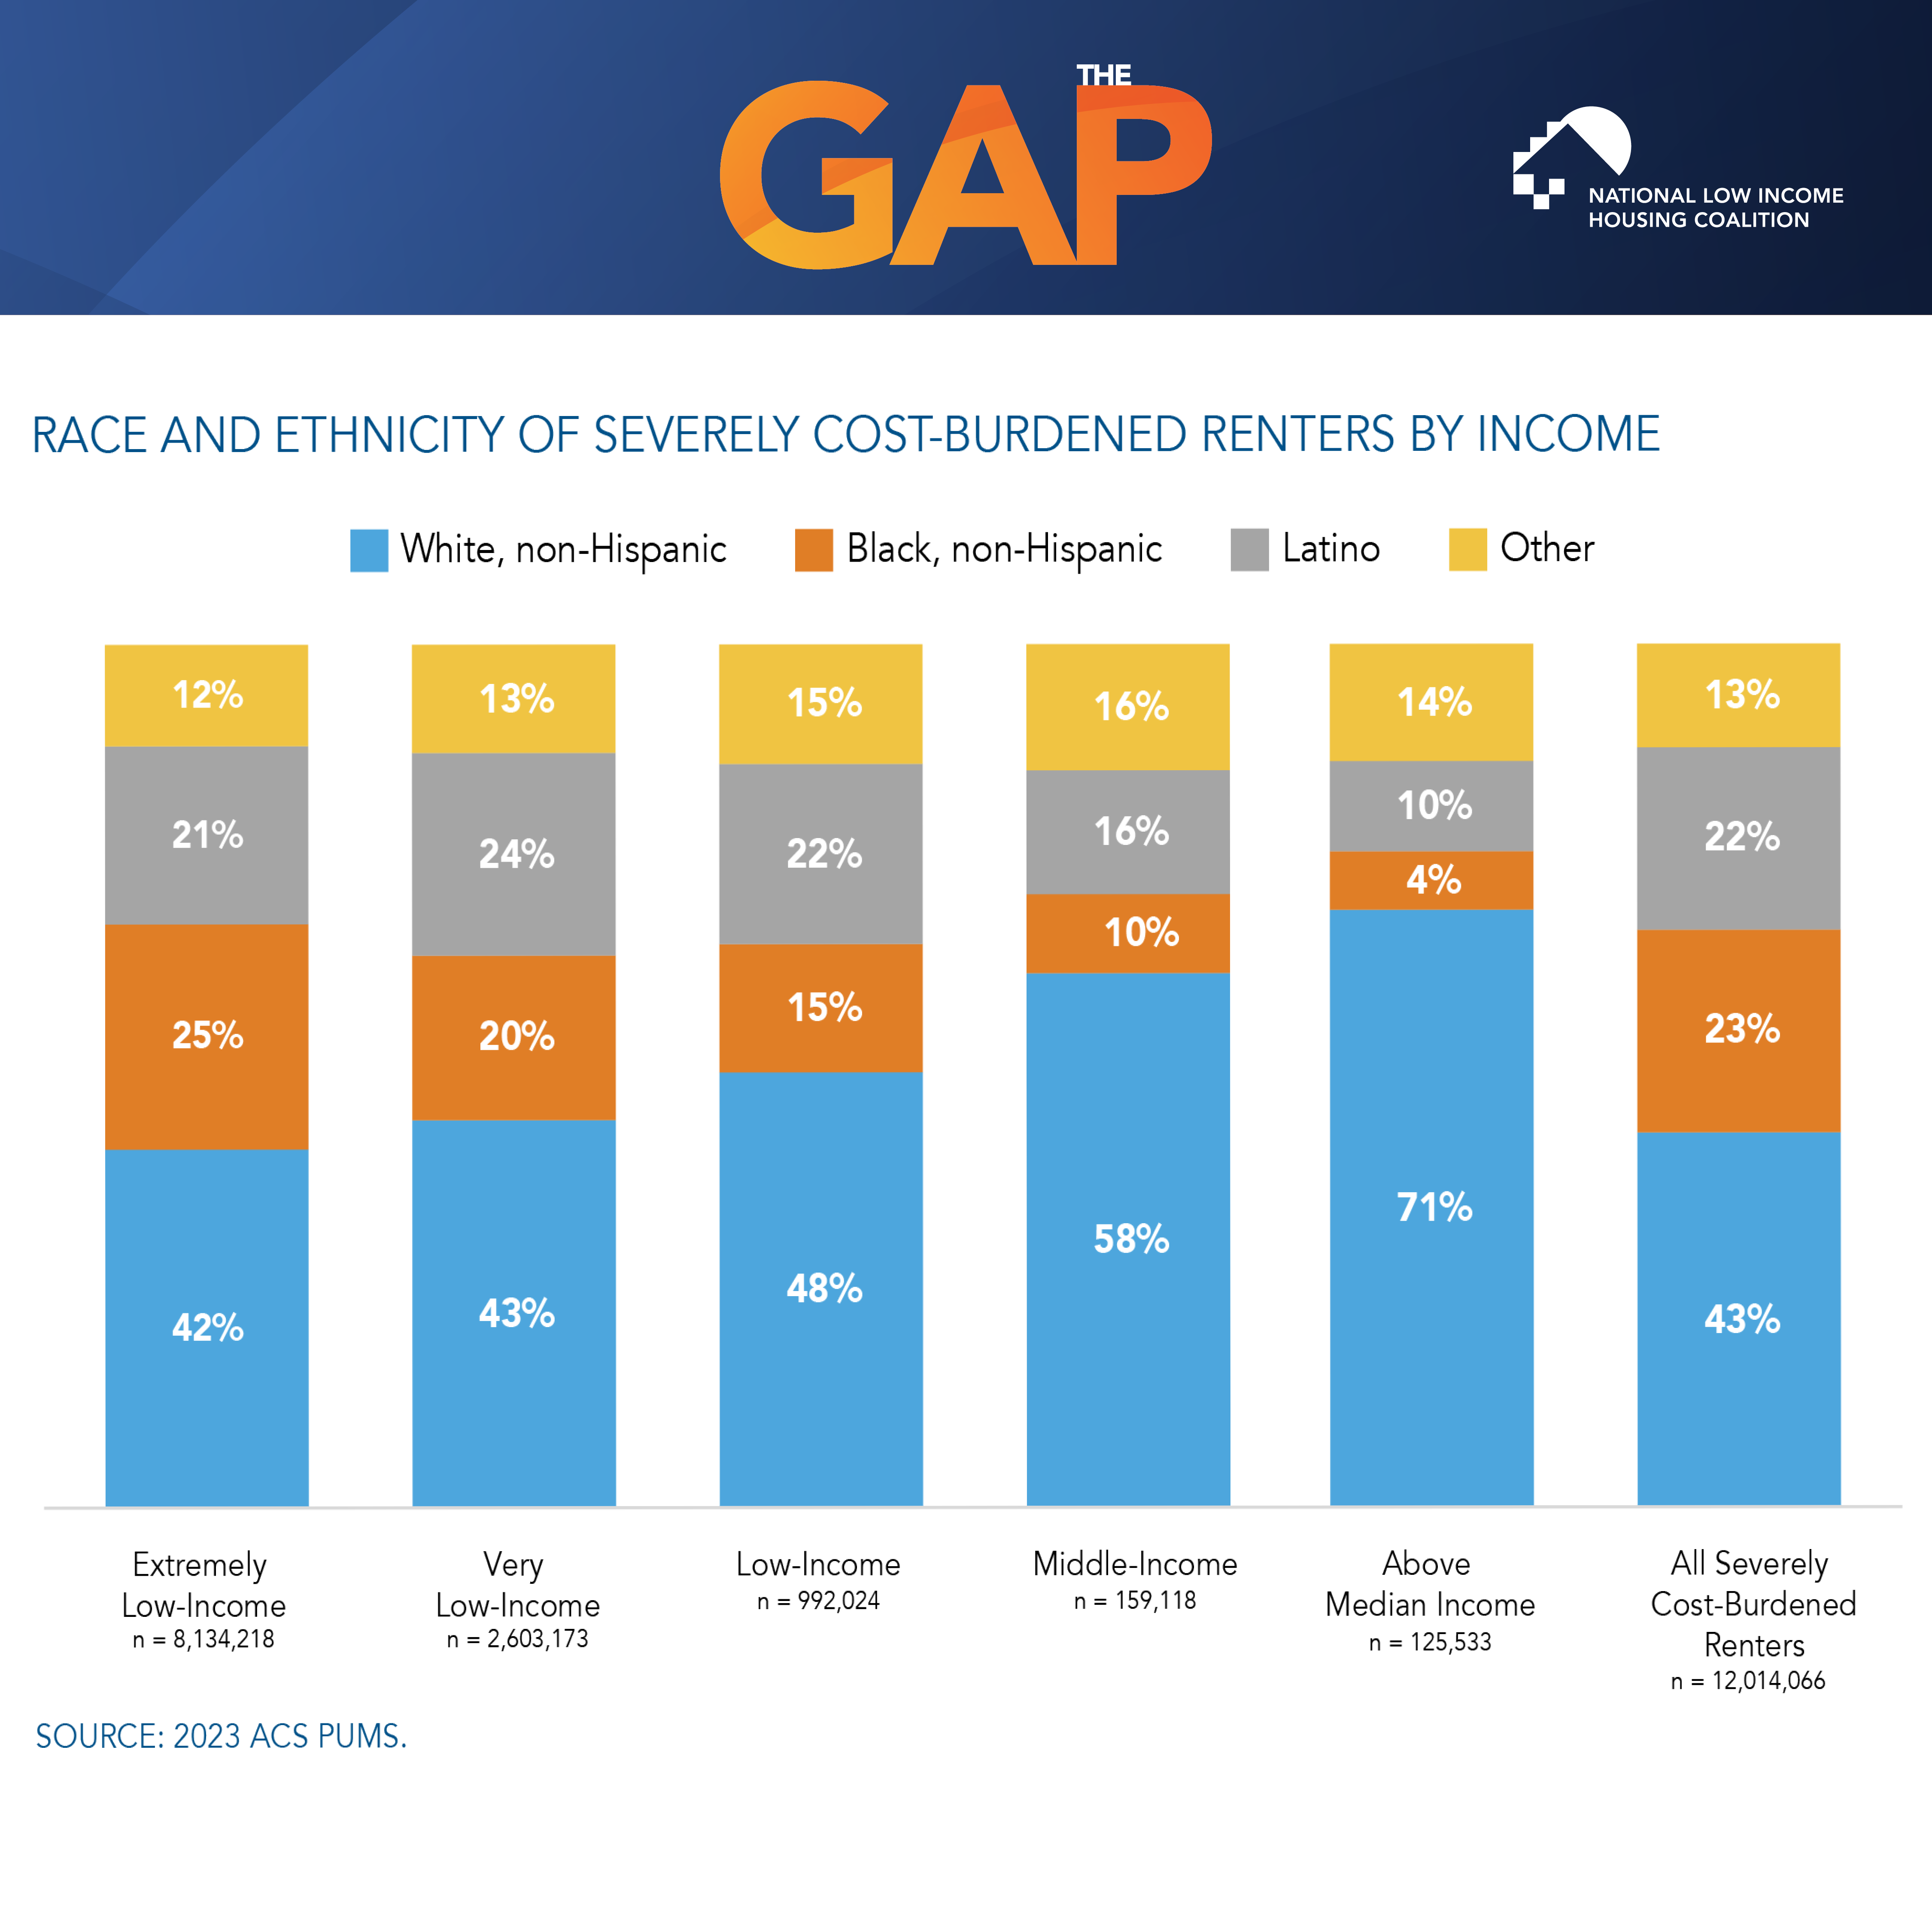
Race and Ethnicity of Severely Cost-Burdened Renters by Income
Black and Latino renters account for 46% of severely- cost-burdened extremely low-income renters. With each subsequently higher income level, they account for a decreasing share of severely cost-burdened renters.
English (PNG)
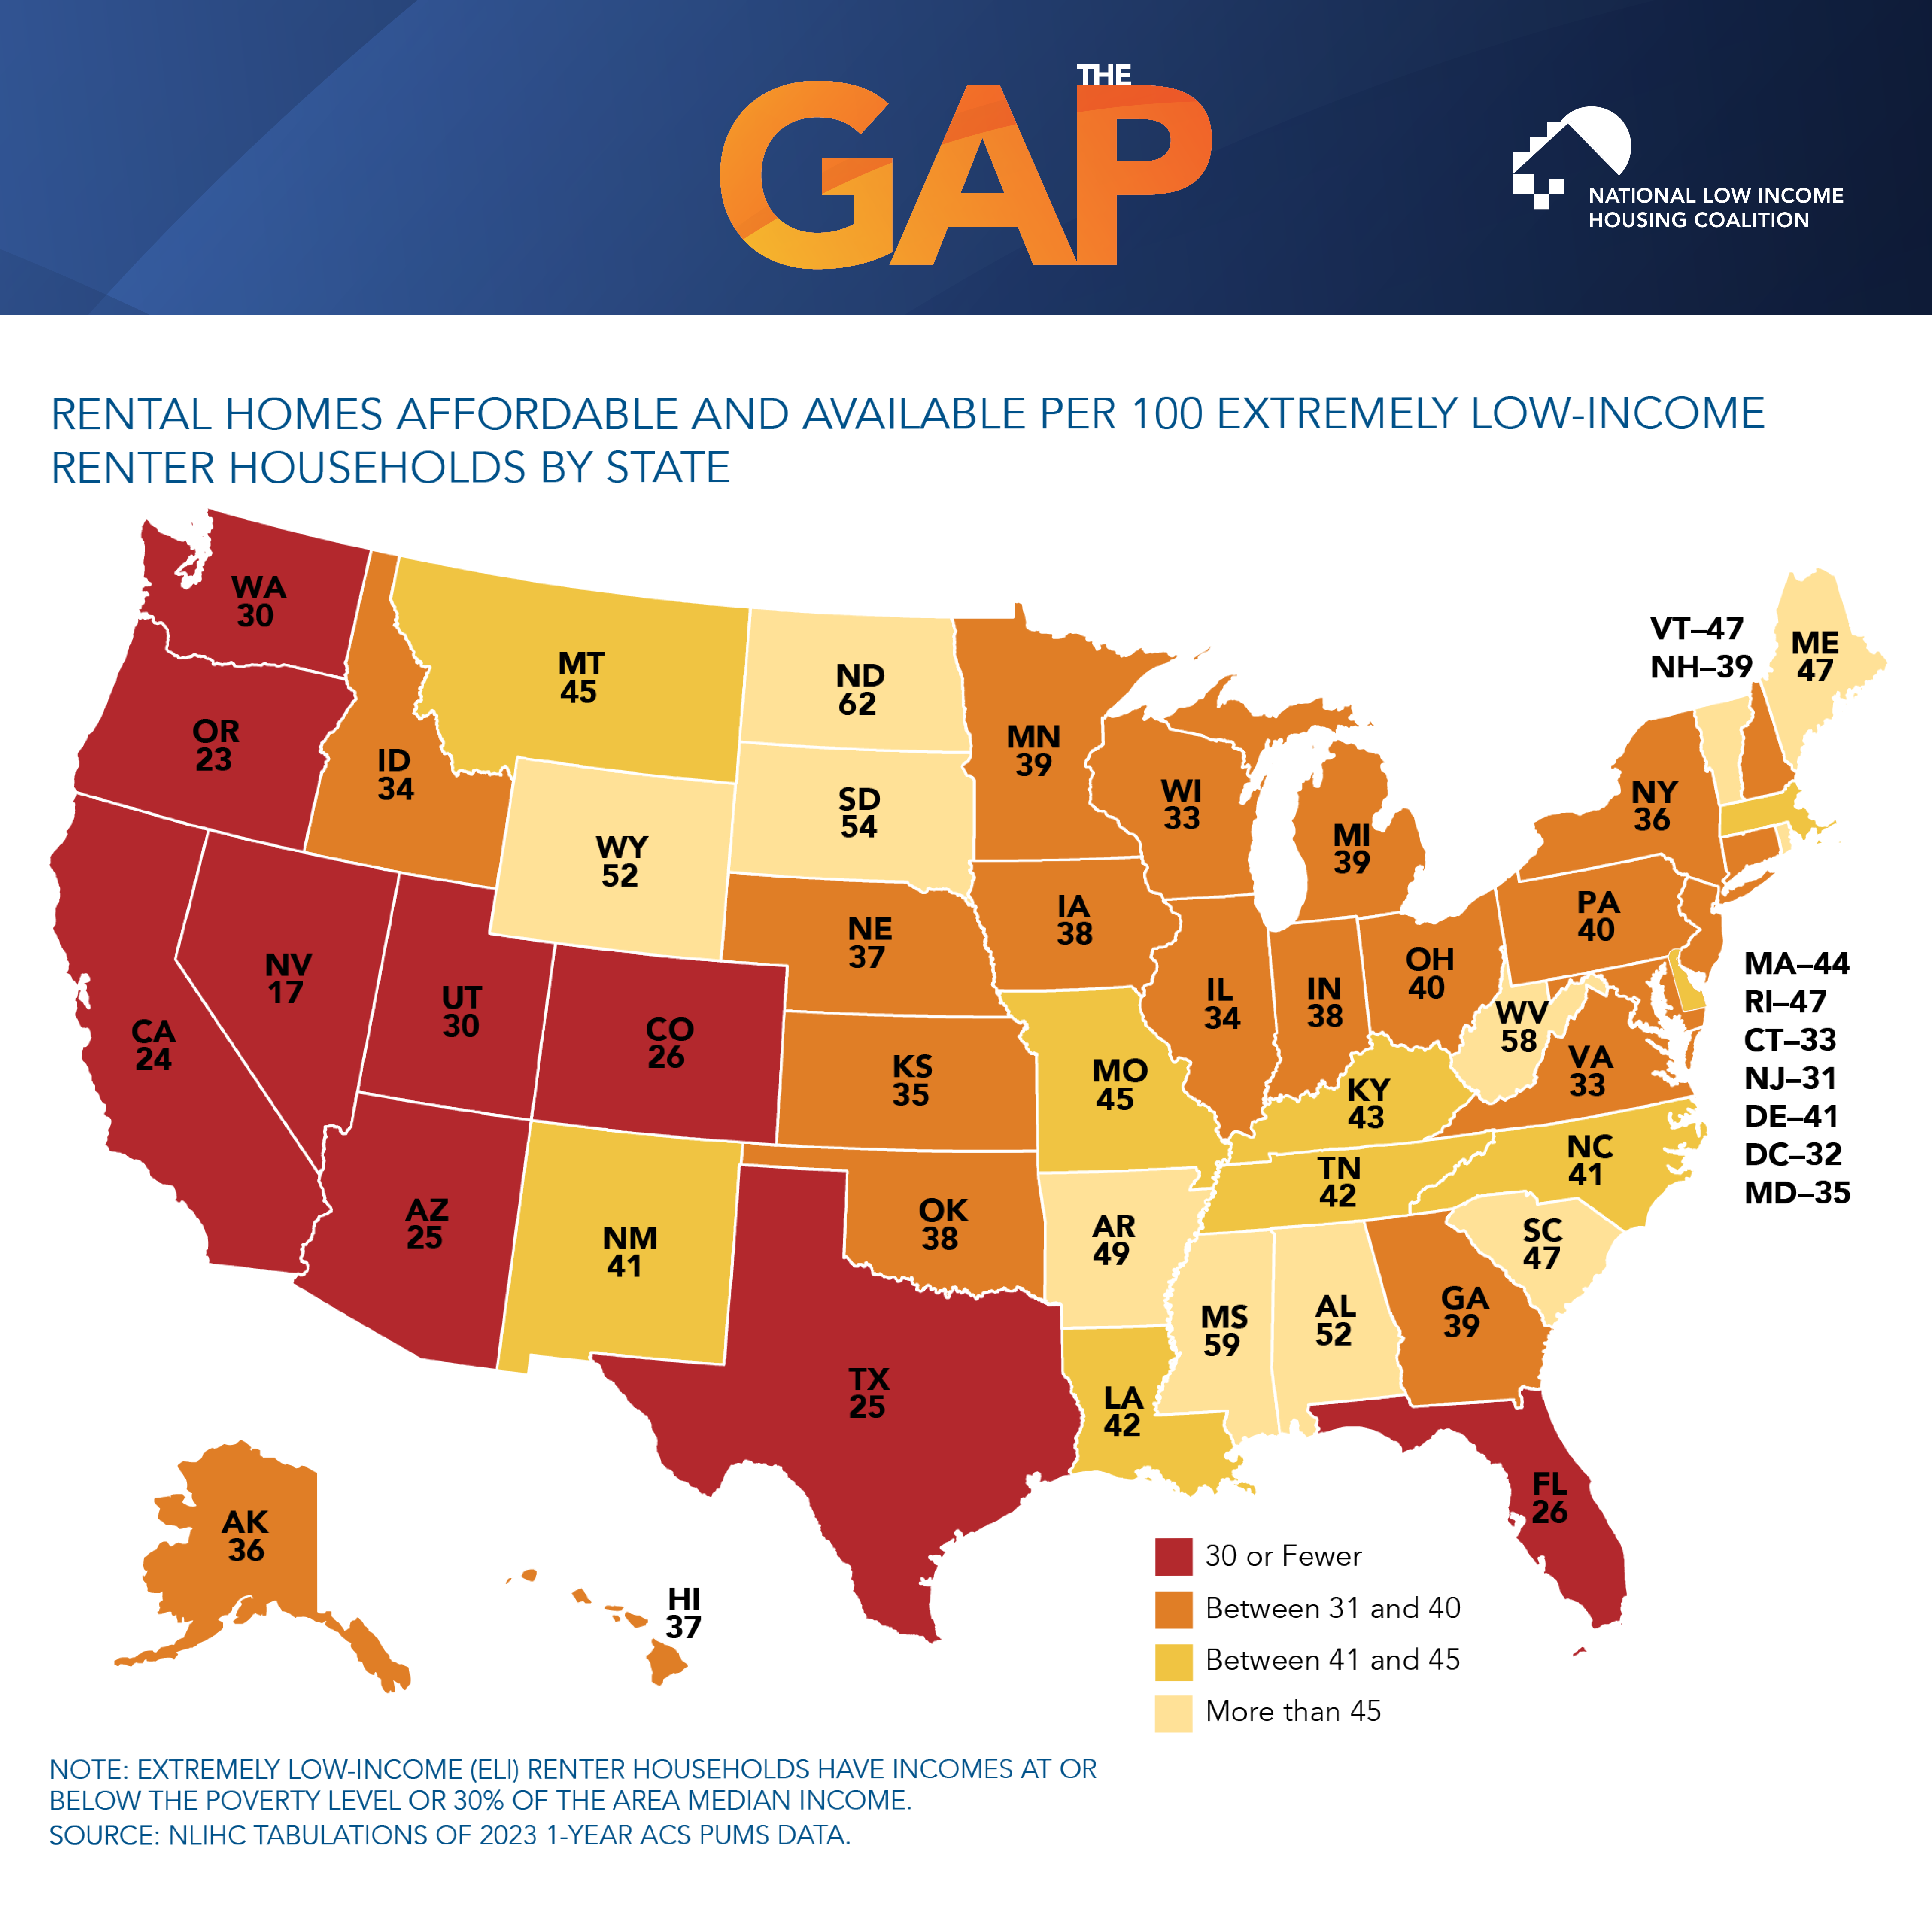
Affordable and Available Rental Homes
Map displaying the number of affordable and available rental homes for every 100 extremely low-income renter households by state. No state has an adequate supply.
English (PNG)
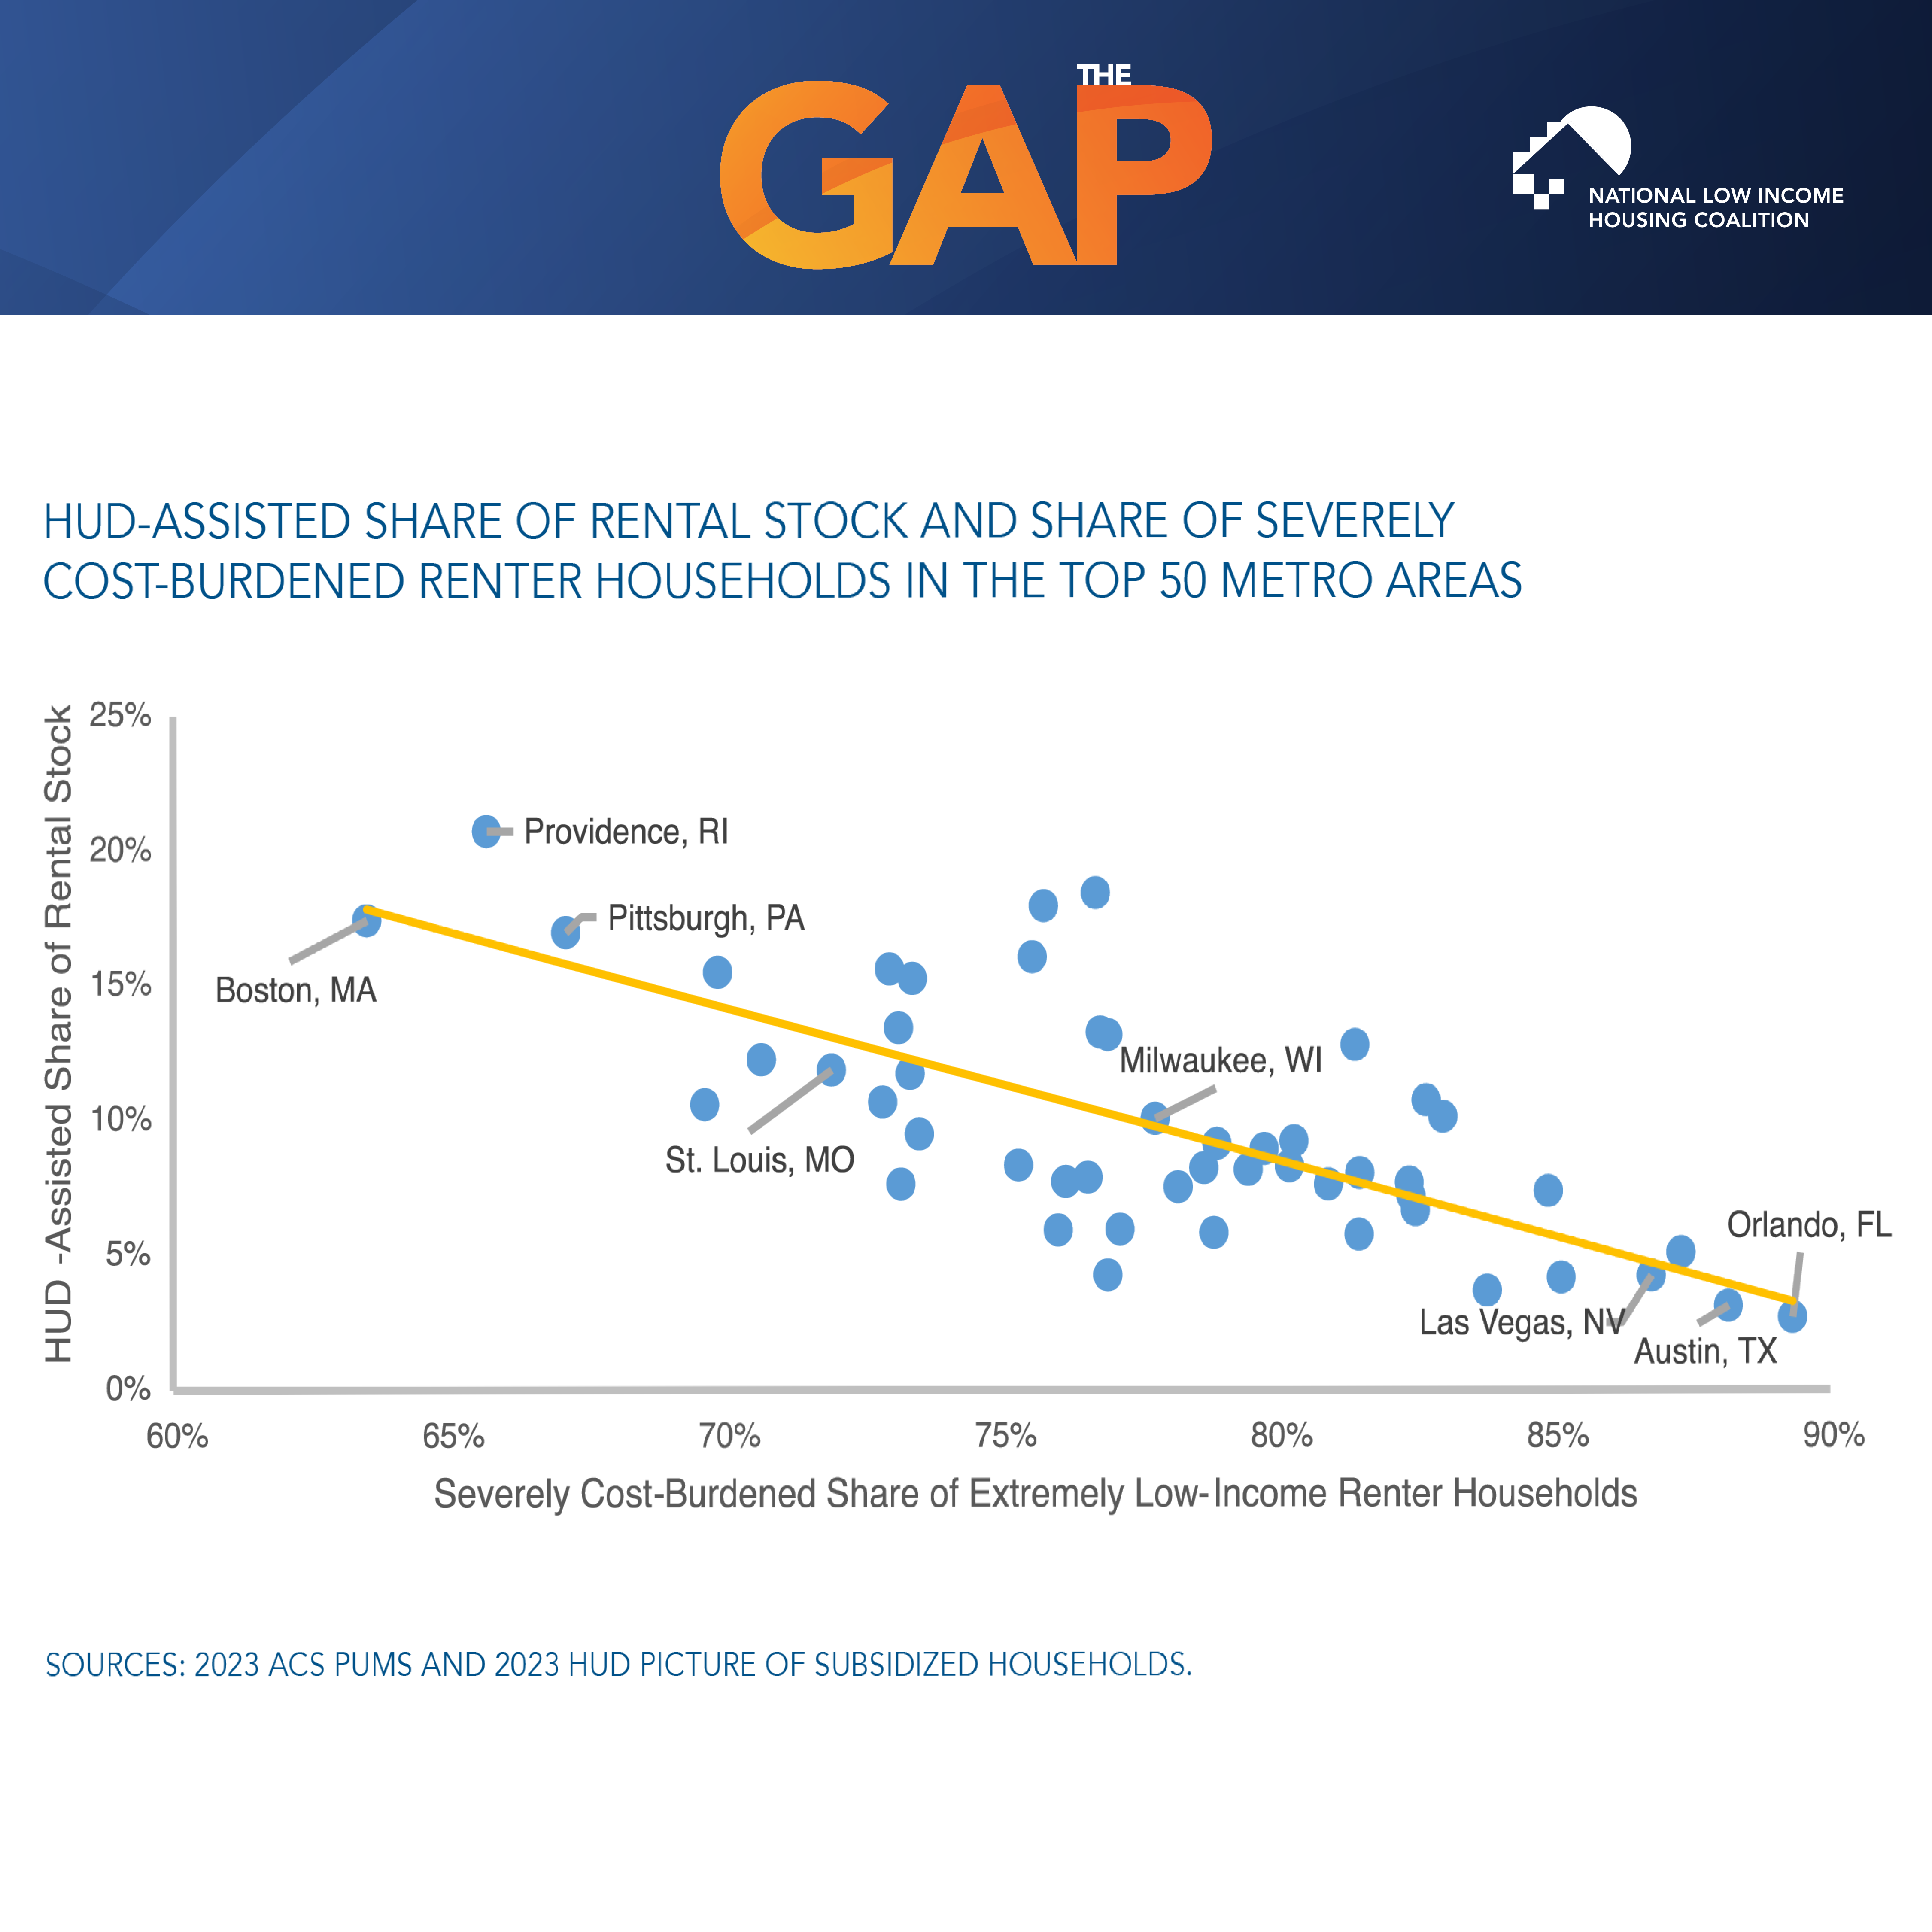
HUD-Assisted Share of Rental Stock and Share of Severely Cost-Burdened Extremely Low-Income Renter Households in Top 50 Metros
Graph showing the HUD-assisted share of rental stock and the share of severely cost-burdened renter households in the top 50 metro areas across the United States. Metro areas with a greater share of HUD-assisted rental housing tend to have a lower prevalence of severe cost burdens among the lowest-income renters.
English (JPG)
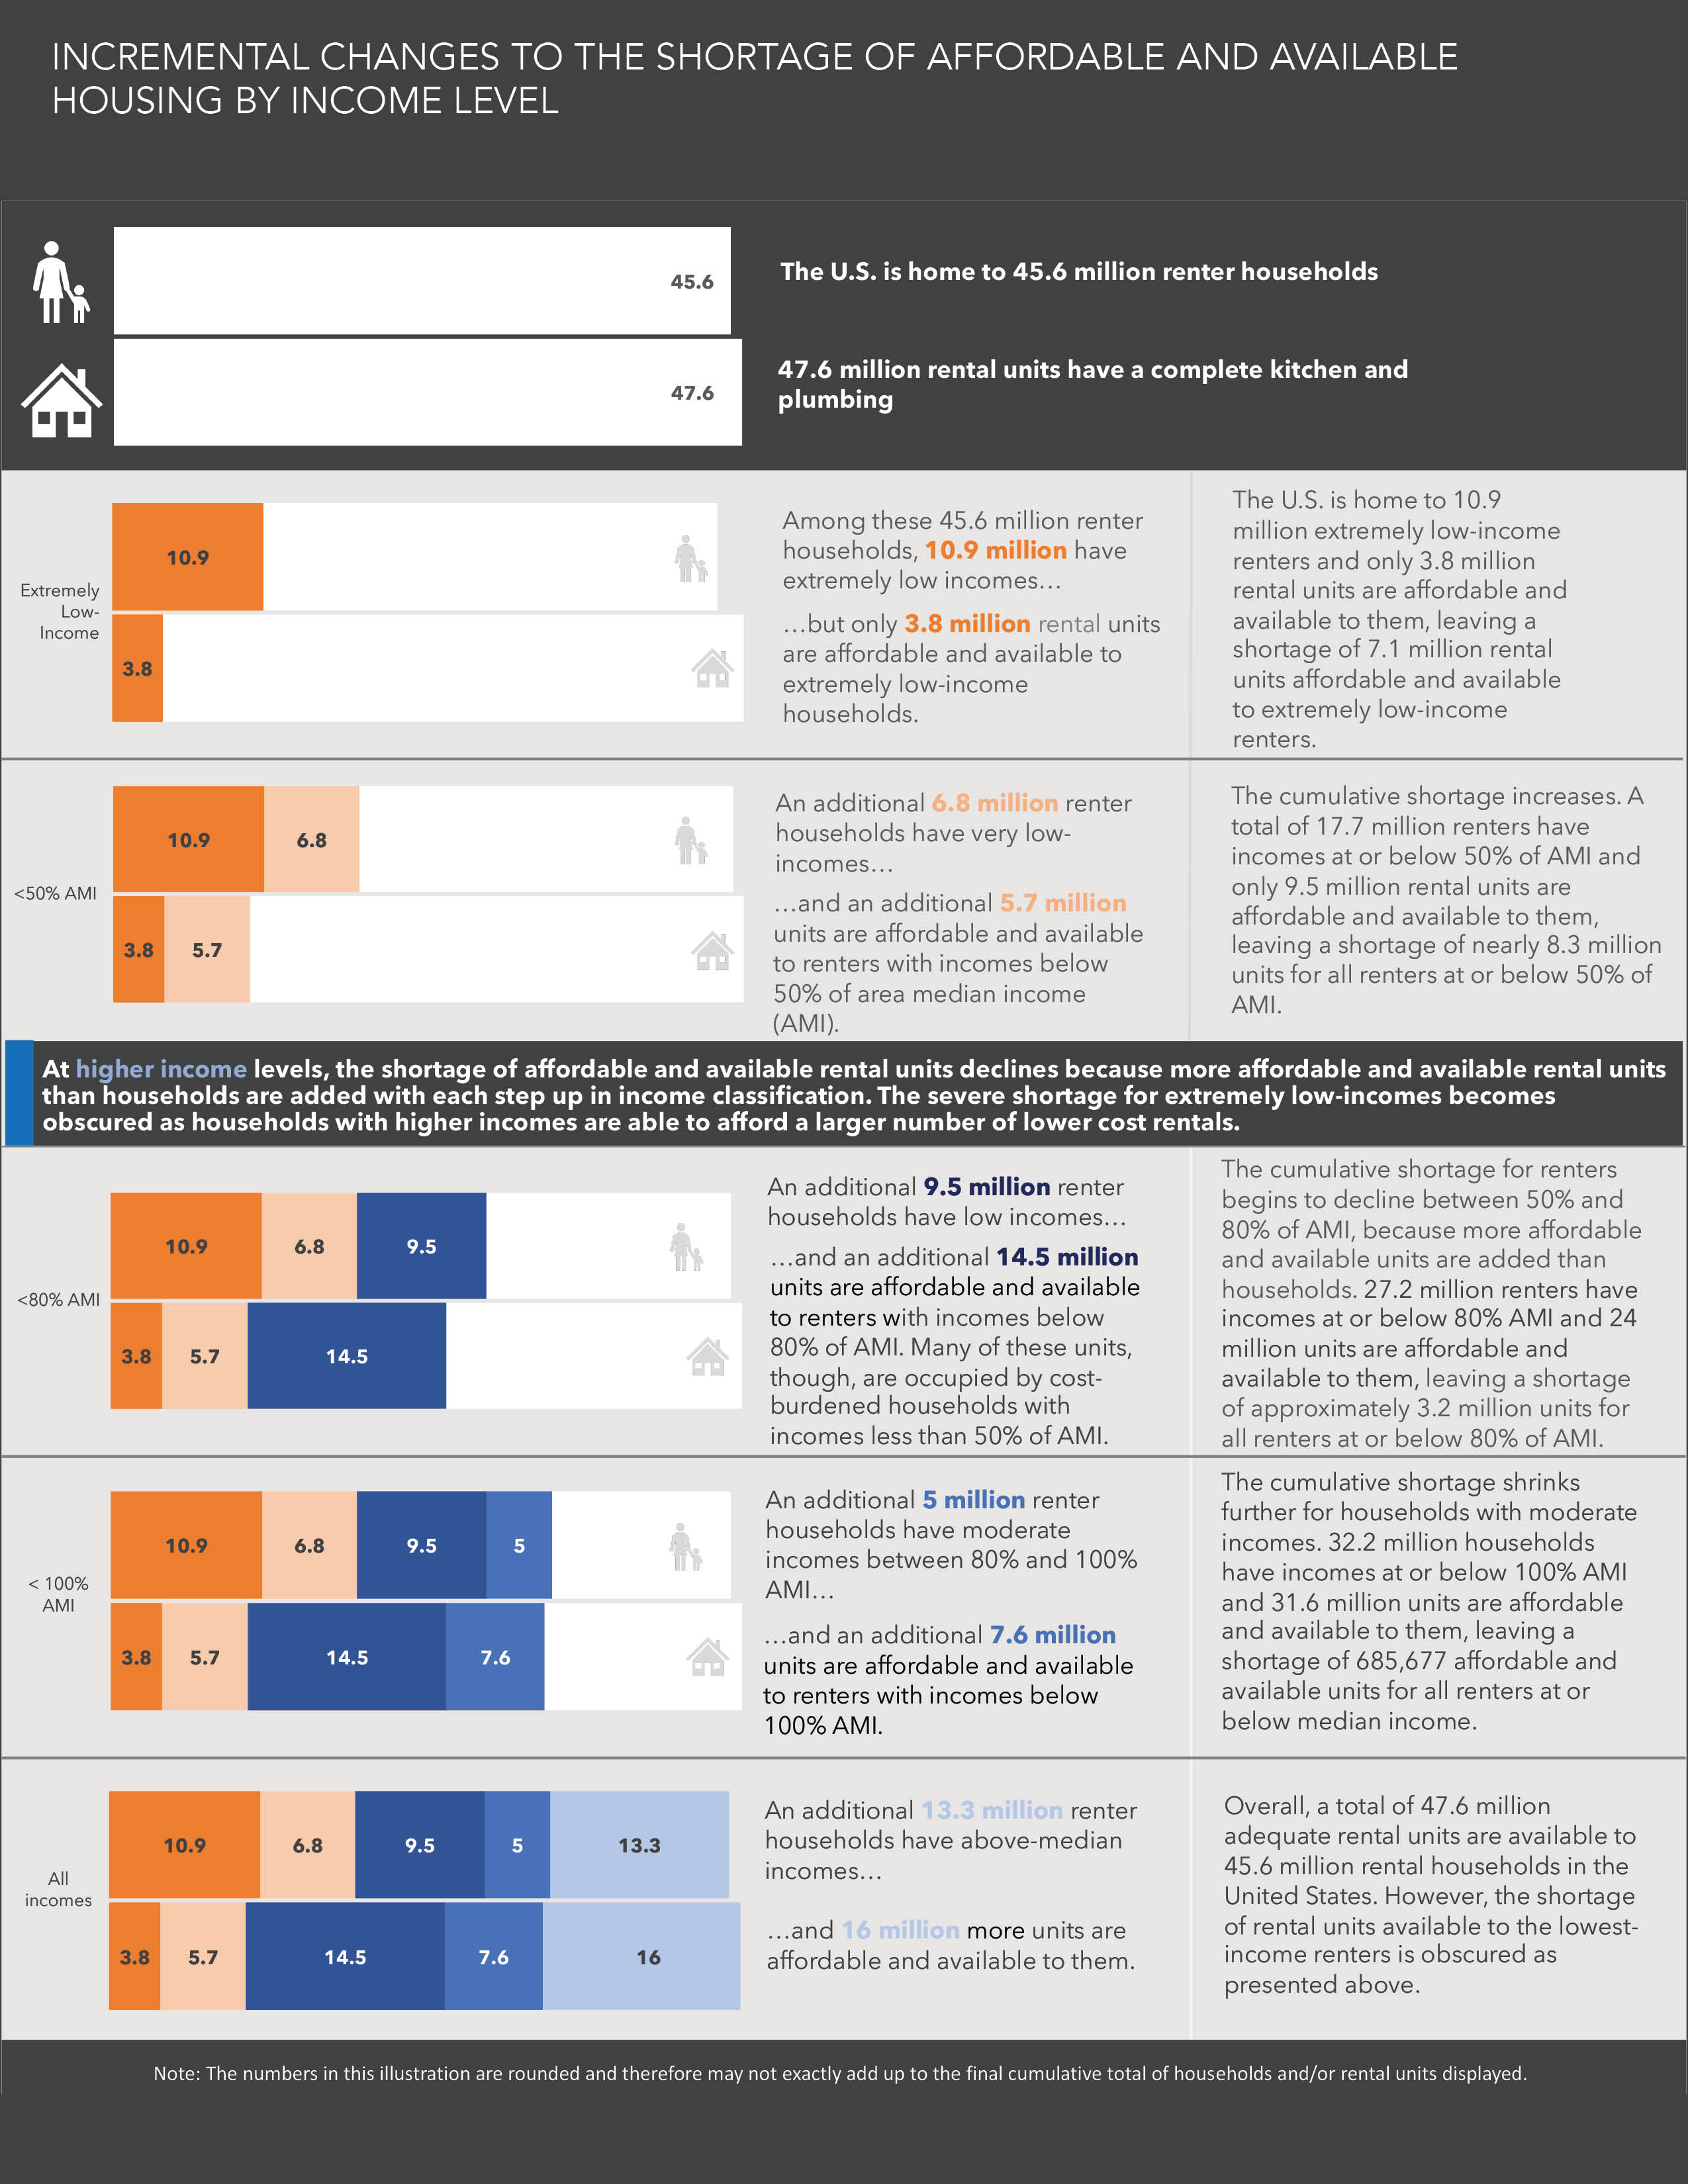
Incremental Changes to the Shortage of Affordable and Available Housing by Income Level
Extremely low-income renters account for most of the shortage of affordable and available rental homes in the United States.